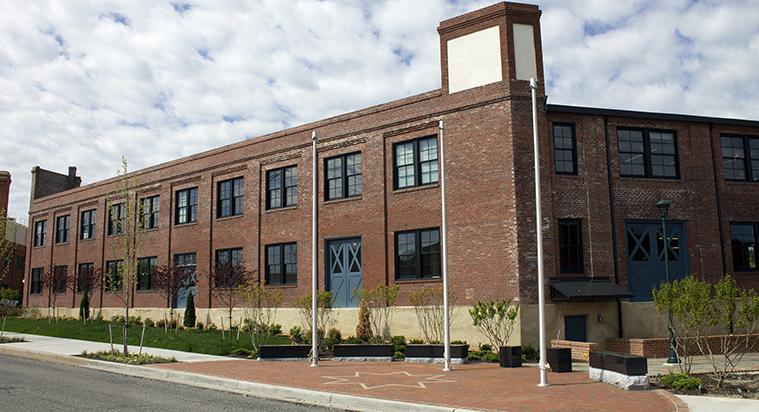
Office Space
2000 West Marshall Street Richmond, VA 23220
2000 West Marshall Street Richmond, VA 23220
Details & Description
Property Highlights
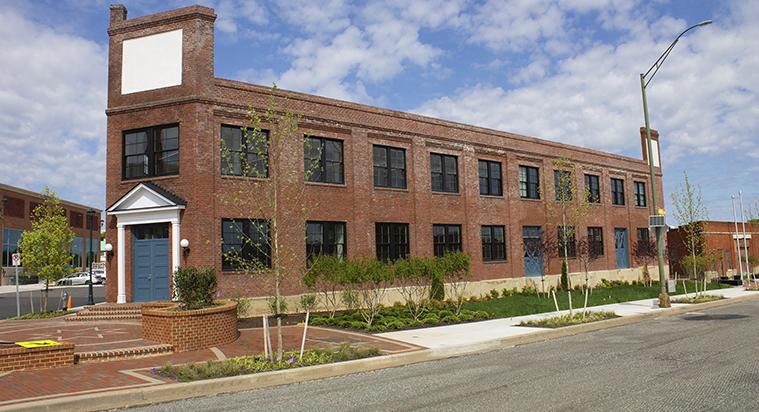
• Historic rehabilitation project converting to Class A office space 2000 W Marshall Street
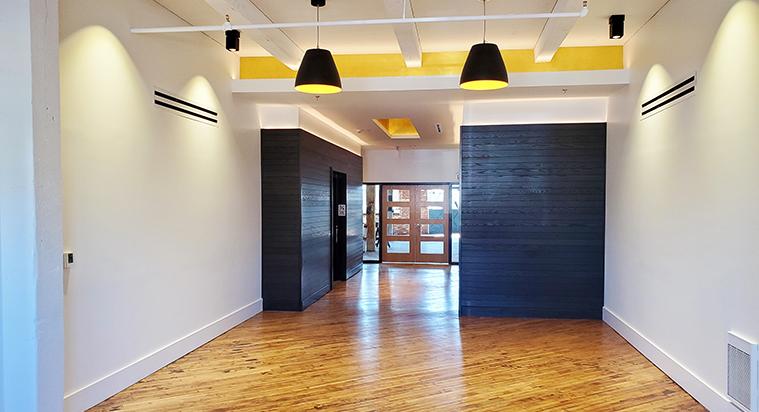
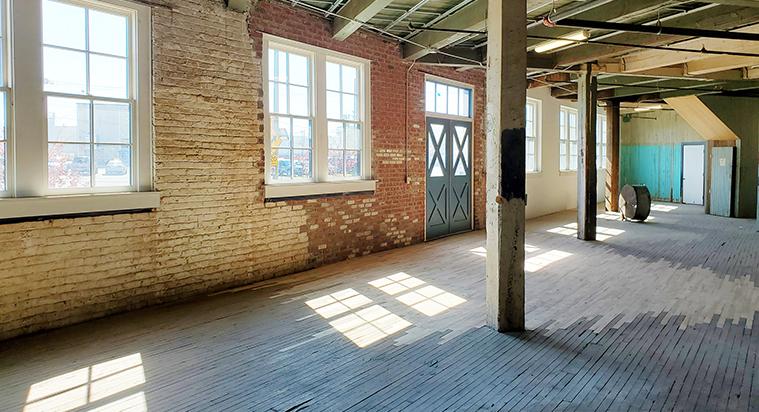
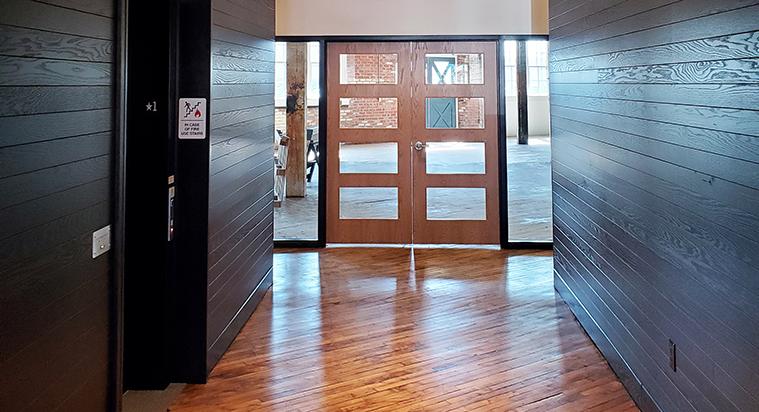
• Gorgeous interior with exposed brick, timber columns and natural light throughout
Additional Photos
Listing Agents

Russell Wyatt
O: 804-433-1817
rwyatt@commonwealthcommercial.com
O: 804-433-1817
rwyatt@commonwealthcommercial.com
While we strive to provide the most accurate information, all listing information, and demographic data, is provided by third-parties. As such, MyEListing will not be responsible for the accuracy of the information. It is strongly recommended that you verify all information with the listing agent, and any relevant agencies, prior to making any decisions.


