Commercial Land
11060 Alpharetta Highway Roswell, GA 30076
11060 Alpharetta Highway Roswell, GA 30076
Details & Description
Property Highlights
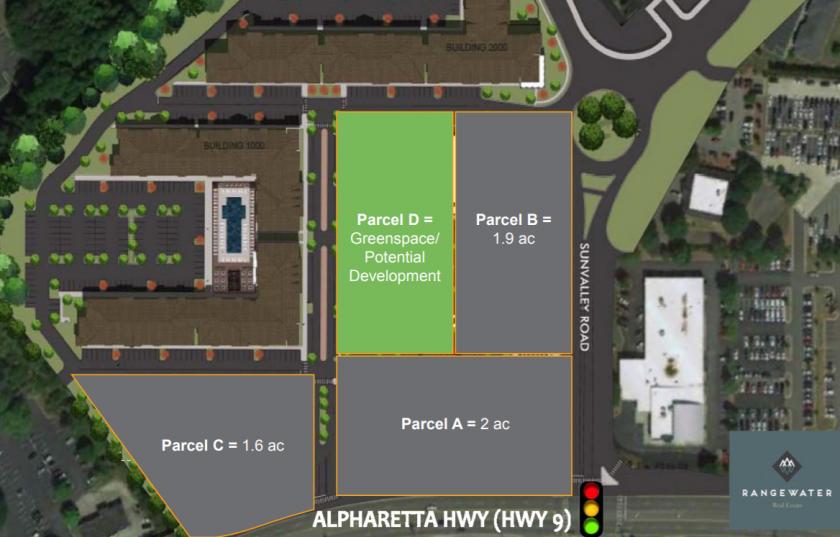
- • Pad sites may be subdivided
- • Drive-thrus approved for this site
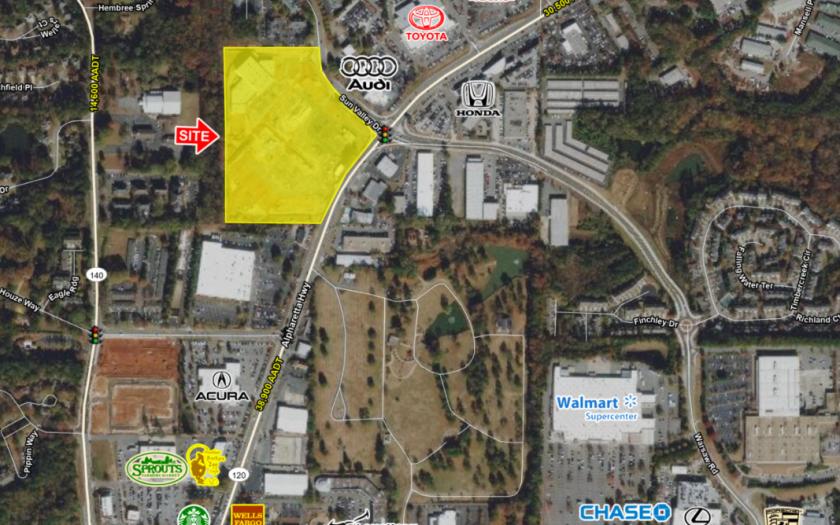
- • Signalized intersection
Listing Agents

Alan Shaw
O: 770-955-2434
alan.shaw@tscg.com
O: 770-955-2434
alan.shaw@tscg.com

Drew Lewis
TSCG
O: 770-955-2434
drew.lewis@tscg.com
TSCG
O: 770-955-2434
drew.lewis@tscg.com
While we strive to provide the most accurate information, all listing information, and demographic data, is provided by third-parties. As such, MyEListing will not be responsible for the accuracy of the information. It is strongly recommended that you verify all information with the listing agent, and any relevant agencies, prior to making any decisions.