Commercial Land
2 Perimeter Center N Atlanta, GA 30346
2 Perimeter Center N Atlanta, GA 30346
Details & Description
Property Highlights
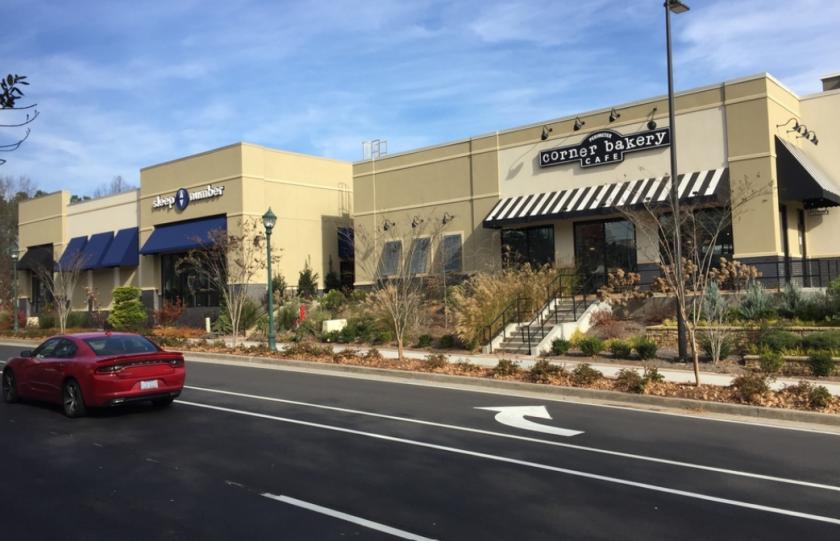
• Maximum restaurant size is 2,350 SF within a potential two tenant building
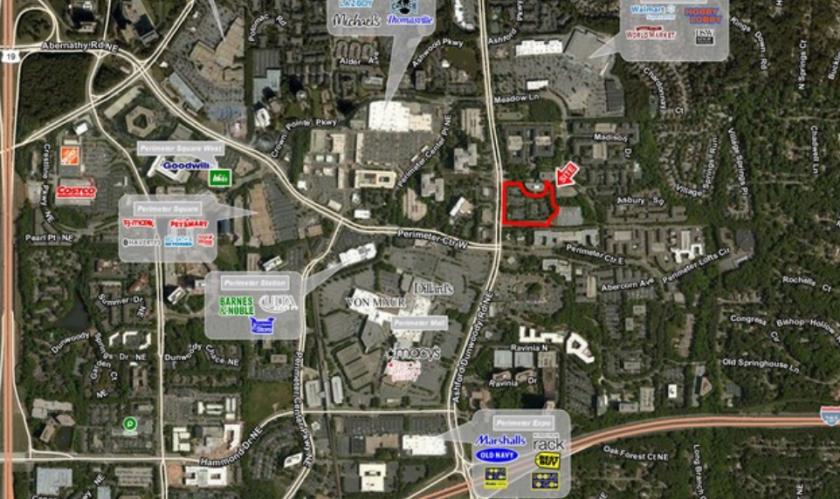
• Signalized access and a right inright out off Ashford-Dunwoody Road
Listing Agents

Alan Shaw
O: 770-955-2434
alan.shaw@tscg.com
O: 770-955-2434
alan.shaw@tscg.com

Drew Lewis
TSCG
O: 770-955-2434
drew.lewis@tscg.com
TSCG
O: 770-955-2434
drew.lewis@tscg.com
While we strive to provide the most accurate information, all listing information, and demographic data, is provided by third-parties. As such, MyEListing will not be responsible for the accuracy of the information. It is strongly recommended that you verify all information with the listing agent, and any relevant agencies, prior to making any decisions.