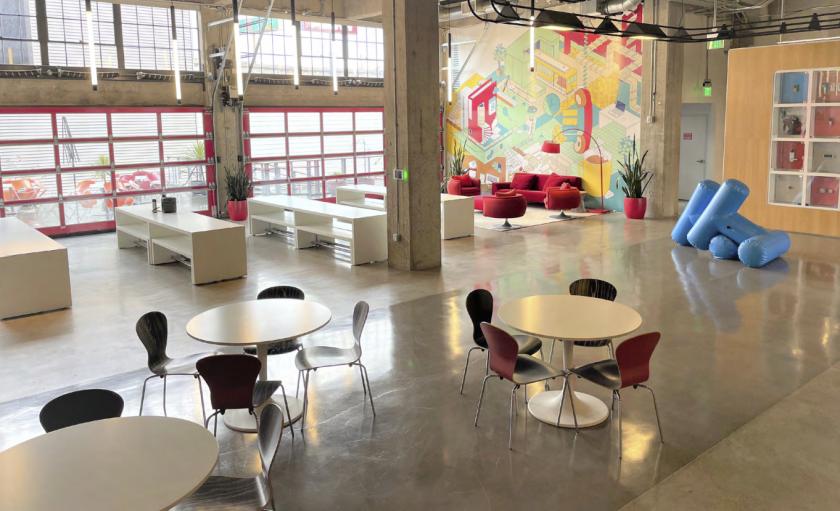
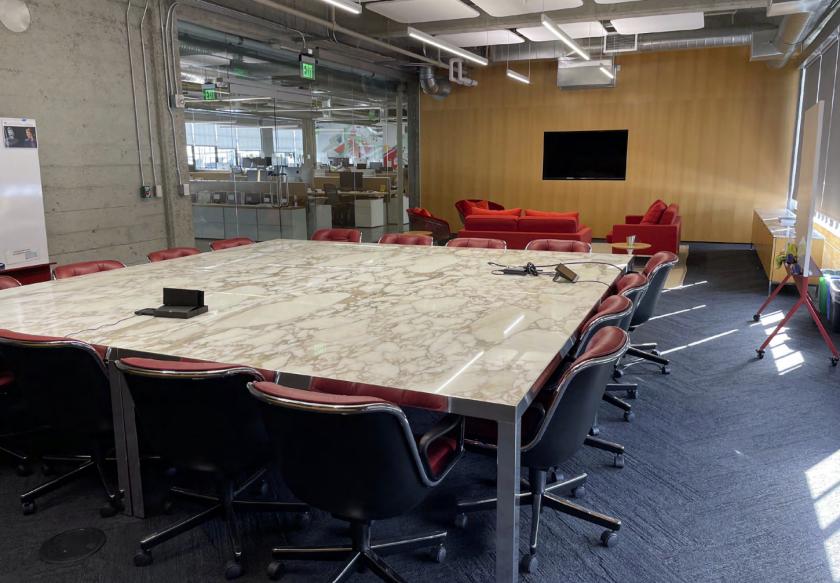
1-Mile | 3-Miles | 5-Miles | ||
---|---|---|---|---|
Total Population | 38,947 | 486,768 | 863,435 | |
Population Median Age | 37 | 40 | 40 | |
Population by Age | 0-9 Yrs | 3385 (8%) | 35416 (7%) | 65779 (7%) |
10-19 Yrs | 2295 (5%) | 28339 (5%) | 65392 (7%) | |
20-29 Yrs | 7176 (18%) | 91760 (18%) | 167067 (19%) | |
30-39 Yrs | 11358 (29%) | 115995 (23%) | 181818 (21%) | |
40-49 Yrs | 5972 (15%) | 68521 (14%) | 116105 (13%) | |
50-59 Yrs | 4192 (10%) | 55808 (11%) | 99911 (11%) | |
60-69 Yrs | 2615 (6%) | 46169 (9%) | 86814 (10%) | |
70+ Yrs | 1954 (5%) | 44760 (9%) | 80548 (9%) | |
Median HH Income | $166,927 | $111,288 | $113,704 | |
Total Household Income | < 24K | 1789 (10%) | 40733 (18%) | 54838 (15%) |
25-49K | 1333 (7%) | 24830 (11%) | 40332 (11%) | |
50-74K | 816 (4%) | 19768 (8%) | 33831 (9%) | |
75-99K | 1264 (7%) | 17662 (7%) | 30562 (8%) | |
100-199K | 4953 (29%) | 55585 (25%) | 93989 (26%) | |
200K+ | 6859 (40%) | 62302 (28%) | 96660 (27%) | |
Highest Education Level | No Diploma | 2506 | 44612 | 76408 |
Diploma or GED | 2700 | 45436 | 81039 | |
Some College | 3876 | 51579 | 91574 | |
Assoc. Degree | 1044 | 16417 | 32422 | |
Bachelors Degree | 11514 | 136446 | 230472 | |
Higher Degree | 9573 | 98974 | 157948 | |
Total Housing Units | 19,050 | 248,997 | 387,116 | |
--Owner-Occupied | 6,681 | 61,469 | 119,298 | |
--Renter-Occupied | 10,332 | 159,412 | 230,915 | |
Owner-Occupied Values | < 100K | 182 | 1186 | 2028 |
100-199K | 47 | 366 | 838 | |
200-299K | 198 | 1025 | 1592 | |
300-399K | 399 | 1814 | 2508 | |
400-499K | 43 | 1660 | 2816 | |
500K+ | 5811 | 55418 | 109516 | |
Total Working Age Population | 34,236 | 435,548 | 762,796 | |
In Work Force | 26,122 | 316,708 | 543,616 | |
Not In Work Force | 8,114 | 118,840 | 219,180 | |
Workforce Employed | 25,384 | 302,130 | 515,346 | |
Workforce Unemployed | 733 | 14,416 | 27,757 | |
Civlian Workforce | 26,117 | 316,545 | 543,103 | |
Military Workforce | 6 | 162 | 514 | |
Total Households | 17,013 | 220,881 | 350,213 | |
Family Households | 8,449 | 89,378 | 162,849 | |
Non-Family Households | 8,564 | 131,503 | 187,364 | |
Married Couple | 6,504 | 66,970 | 119,867 | |
Other Family | 1,946 | 22,407 | 42,982 | |
Married w/Child | 2,304 | 22,444 | 42,187 | |
Single Male w/Child | 147 | 1,861 | 3,423 | |
Single Female w/Child | 729 | 6,305 | 12,023 |
Population Change Last Two Decades - Plus Projection
2000 | % | 2010 | % | 2020 | % | 2030 | |
---|---|---|---|---|---|---|---|
California | 33,871,648 | +10 | 37,253,956 | +9 | 40,467,295 | +8 | 43,631,295 |
Alameda County | 1,443,741 | +5 | 1,510,271 | +12 | 1,696,752 | +10 | 1,861,027 |
Contra Costa County | 948,816 | +11 | 1,049,025 | +12 | 1,171,305 | +11 | 1,296,786 |
Marin County | 247,289 | +2 | 252,409 | +4 | 263,085 | +2 | 267,912 |
San Francisco County | 776,733 | +4 | 805,235 | +12 | 903,294 | +8 | 976,481 |
San Mateo County | 707,161 | +2 | 718,451 | +9 | 785,650 | +6 | 833,868 |
Total Working Age Population:
Total Households:
Total Working Age Population:
Total Households:
Total Working Age Population:
Total Households: