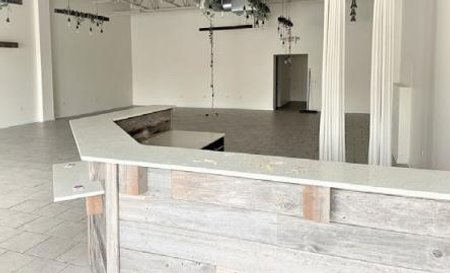
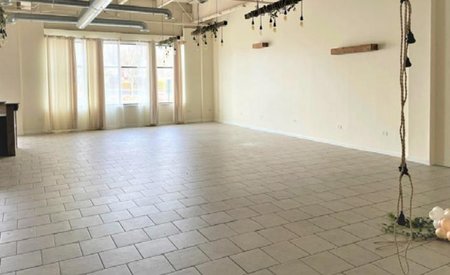
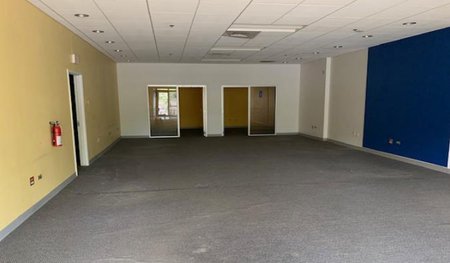
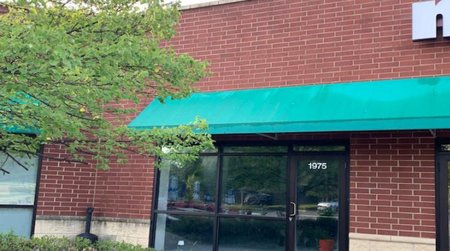
1-Mile | 3-Miles | 5-Miles | ||
---|---|---|---|---|
Total Population | 5,089 | 51,286 | 145,318 | |
Population Median Age | 39 | 36 | 37 | |
Population by Age | 0-9 Yrs | 430 (8%) | 7056 (13%) | 19711 (13%) |
10-19 Yrs | 914 (17%) | 8643 (16%) | 21815 (15%) | |
20-29 Yrs | 615 (12%) | 6733 (13%) | 19432 (13%) | |
30-39 Yrs | 489 (9%) | 5956 (11%) | 17787 (12%) | |
40-49 Yrs | 855 (16%) | 7428 (14%) | 19828 (13%) | |
50-59 Yrs | 848 (16%) | 7135 (13%) | 19753 (13%) | |
60-69 Yrs | 638 (12%) | 4963 (9%) | 15657 (10%) | |
70+ Yrs | 301 (5%) | 3371 (6%) | 11335 (7%) | |
Median HH Income | $107,291 | $86,055 | $79,882 | |
Total Household Income | < 24K | 94 (5%) | 2047 (12%) | 5850 (12%) |
25-49K | 158 (9%) | 2390 (14%) | 8593 (17%) | |
50-74K | 331 (18%) | 2832 (17%) | 8346 (17%) | |
75-99K | 222 (12%) | 2135 (12%) | 6889 (14%) | |
100-199K | 693 (39%) | 5220 (31%) | 14338 (29%) | |
200K+ | 252 (14%) | 1802 (10%) | 4253 (8%) | |
Highest Education Level | No Diploma | 207 | 4833 | 14645 |
Diploma or GED | 721 | 7194 | 22274 | |
Some College | 883 | 7007 | 20346 | |
Assoc. Degree | 319 | 2702 | 7682 | |
Bachelors Degree | 792 | 7018 | 19501 | |
Higher Degree | 489 | 3234 | 9171 | |
Total Housing Units | 1,787 | 17,083 | 50,869 | |
--Owner-Occupied | 1,488 | 12,264 | 36,252 | |
--Renter-Occupied | 262 | 4,162 | 12,016 | |
Owner-Occupied Values | < 100K | 56 | 831 | 2587 |
100-199K | 374 | 3611 | 13190 | |
200-299K | 589 | 4342 | 12050 | |
300-399K | 329 | 2630 | 5944 | |
400-499K | 93 | 615 | 1593 | |
500K+ | 47 | 236 | 888 | |
Total Working Age Population | 4,103 | 39,017 | 112,395 | |
In Work Force | 3,011 | 27,972 | 79,041 | |
Not In Work Force | 1,092 | 11,045 | 33,354 | |
Workforce Employed | 2,930 | 26,611 | 74,985 | |
Workforce Unemployed | 81 | 1,345 | 3,986 | |
Civlian Workforce | 3,011 | 27,955 | 78,971 | |
Military Workforce | 0 | 17 | 70 | |
Total Households | 1,750 | 16,426 | 48,269 | |
Family Households | 1,327 | 12,292 | 35,344 | |
Non-Family Households | 423 | 4,135 | 12,925 | |
Married Couple | 1,097 | 9,395 | 26,958 | |
Other Family | 230 | 2,896 | 8,387 | |
Married w/Child | 453 | 4,488 | 12,453 | |
Single Male w/Child | 53 | 421 | 1,126 | |
Single Female w/Child | 75 | 1,251 | 3,191 |
Population Change Last Two Decades - Plus Projection
2000 | % | 2010 | % | 2020 | % | 2030 | |
---|---|---|---|---|---|---|---|
Illinois | 12,419,293 | +3 | 12,830,632 | +12 | 14,316,487 | +6 | 15,138,849 |
Cook County | 5,376,741 | -3 | 5,194,675 | +10 | 5,707,832 | +5 | 5,990,243 |
Kane County | 404,119 | +28 | 515,269 | +22 | 630,563 | +8 | 679,403 |
McHenry County | 260,077 | +19 | 308,760 | +32 | 407,931 | +9 | 443,398 |
Total Working Age Population:
Total Households:
Total Working Age Population:
Total Households:
Total Working Age Population:
Total Households: