Office Space
1000 River Rock Drive Folsom, CA 95630
1000 River Rock Drive Folsom, CA 95630
Details & Description
Property Highlights
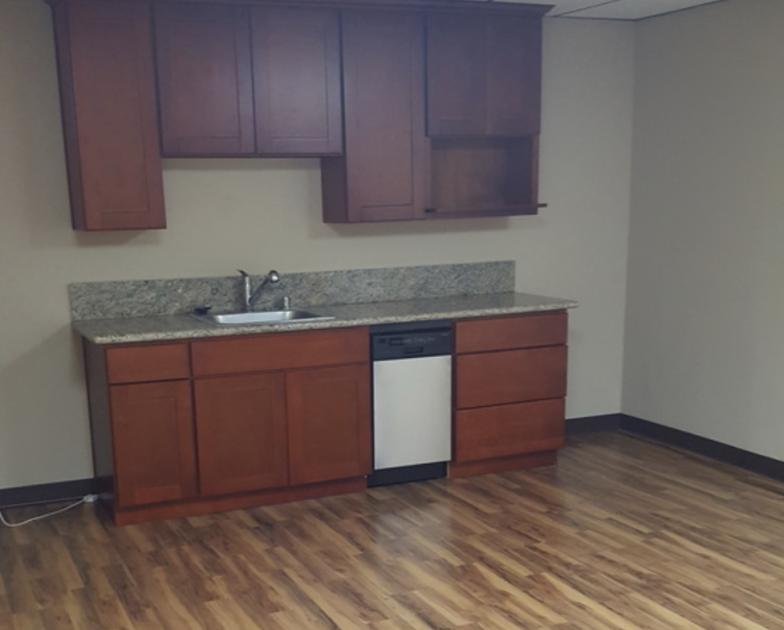
- • Small Suites at Affordable Prices
- • Full Service Lease- Includes Utilities
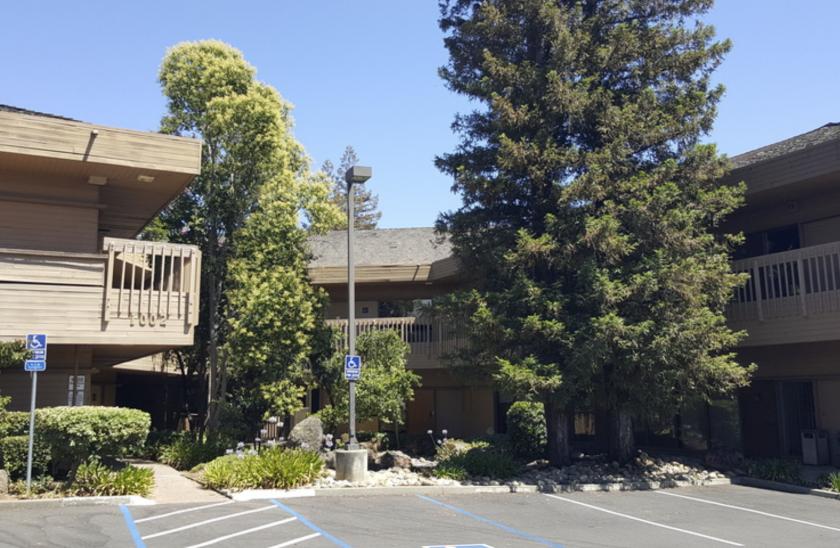
- • Well Manicured Landscaping
- • Floor to Ceiling Windows in Most Offices
- • Flexible Terms
- • Abundant Parking
Listing Agents

Doug Scalzi
KW Commercial
O: 916-220-6200
doug@sacprop.com
KW Commercial
O: 916-220-6200
doug@sacprop.com
While we strive to provide the most accurate information, all listing information, and demographic data, is provided by third-parties. As such, MyEListing will not be responsible for the accuracy of the information. It is strongly recommended that you verify all information with the listing agent, and any relevant agencies, prior to making any decisions.