Industrial Properties
235 West Road Portsmouth, NH 03801
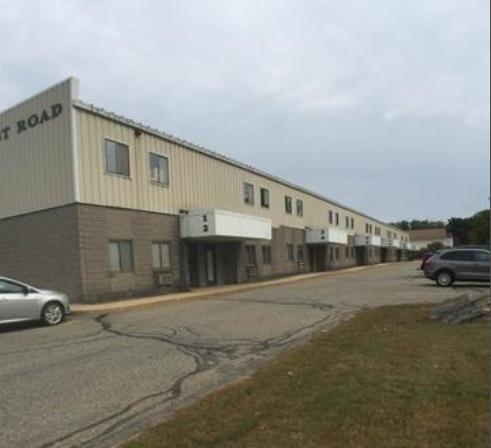
235 West Road Portsmouth, NH 03801
Details & Description
Property Highlights
- • CENTRAL LOCATION TO SEACOAST NEW HAMPSHIRE
- • 7 DEDICATED PARKING SPOTS
- • EASY ACCESS TO INTERSTATE AND LOCAL ROADS
Listing Agents

Jameson Paine
KW Commercial
O: 603-610-8500
M: 603-770-3758
jameson.paine@kwcommercial.com
KW Commercial
O: 603-610-8500
M: 603-770-3758
jameson.paine@kwcommercial.com
While we strive to provide the most accurate information, all listing information, and demographic data, is provided by third-parties. As such, MyEListing will not be responsible for the accuracy of the information. It is strongly recommended that you verify all information with the listing agent, and any relevant agencies, prior to making any decisions.