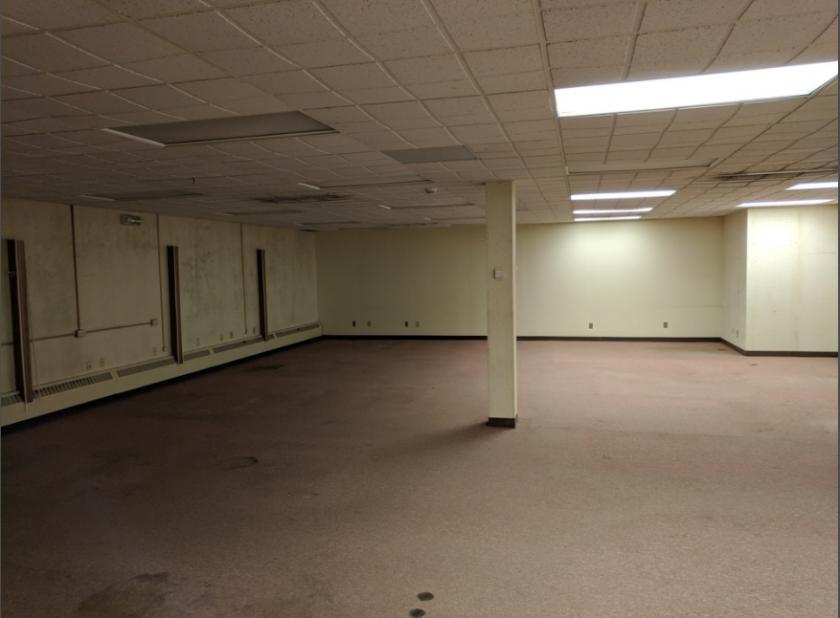
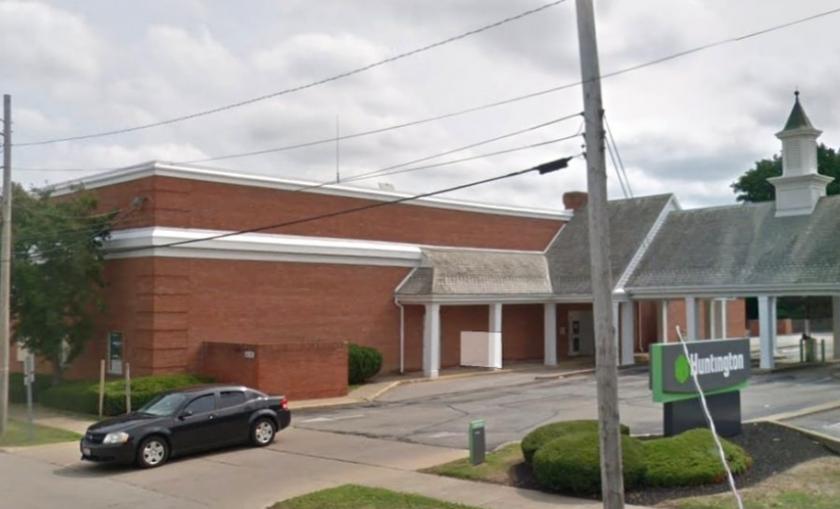
1-Mile | 3-Miles | 5-Miles | ||
---|---|---|---|---|
Total Population | 8,213 | 25,620 | 34,976 | |
Population Median Age | 40 | 40 | 42 | |
Population by Age | 0-9 Yrs | 937 (11%) | 3051 (11%) | 3780 (10%) |
10-19 Yrs | 1163 (14%) | 3184 (12%) | 4097 (11%) | |
20-29 Yrs | 996 (12%) | 3280 (12%) | 4182 (11%) | |
30-39 Yrs | 1002 (12%) | 2992 (11%) | 3826 (10%) | |
40-49 Yrs | 928 (11%) | 3015 (11%) | 4208 (12%) | |
50-59 Yrs | 1059 (12%) | 3474 (13%) | 4905 (14%) | |
60-69 Yrs | 1345 (16%) | 3762 (14%) | 5330 (15%) | |
70+ Yrs | 782 (9%) | 2862 (11%) | 4649 (13%) | |
Median HH Income | $28,363 | $34,572 | $40,904 | |
Total Household Income | < 24K | 1520 (43%) | 4036 (37%) | 5032 (33%) |
25-49K | 1037 (29%) | 2935 (27%) | 3745 (24%) | |
50-74K | 451 (12%) | 1687 (15%) | 2589 (17%) | |
75-99K | 239 (6%) | 1031 (9%) | 1829 (12%) | |
100-199K | 245 (6%) | 1010 (9%) | 1555 (10%) | |
200K+ | 9 (0%) | 119 (1%) | 258 (1%) | |
Highest Education Level | No Diploma | 917 | 2656 | 3259 |
Diploma or GED | 2667 | 7992 | 10718 | |
Some College | 1027 | 3341 | 4994 | |
Assoc. Degree | 447 | 1523 | 2189 | |
Bachelors Degree | 426 | 1657 | 2823 | |
Higher Degree | 141 | 649 | 1177 | |
Total Housing Units | 4,120 | 12,666 | 17,499 | |
--Owner-Occupied | 1,729 | 6,110 | 9,492 | |
--Renter-Occupied | 1,772 | 4,708 | 5,515 | |
Owner-Occupied Values | < 100K | 1469 | 3968 | 5066 |
100-199K | 234 | 1694 | 3314 | |
200-299K | 16 | 259 | 665 | |
300-399K | 0 | 113 | 247 | |
400-499K | 0 | 47 | 142 | |
500K+ | 9 | 29 | 58 | |
Total Working Age Population | 6,602 | 20,617 | 28,729 | |
In Work Force | 3,322 | 11,189 | 15,754 | |
Not In Work Force | 3,280 | 9,428 | 12,974 | |
Workforce Employed | 3,025 | 10,331 | 14,682 | |
Workforce Unemployed | 297 | 858 | 1,073 | |
Civlian Workforce | 3,322 | 11,189 | 15,754 | |
Military Workforce | 0 | 0 | 0 | |
Total Households | 3,501 | 10,818 | 15,006 | |
Family Households | 1,930 | 6,341 | 9,026 | |
Non-Family Households | 1,571 | 4,477 | 5,980 | |
Married Couple | 1,244 | 4,035 | 6,124 | |
Other Family | 686 | 2,305 | 2,902 | |
Married w/Child | 494 | 1,295 | 1,751 | |
Single Male w/Child | 83 | 255 | 345 | |
Single Female w/Child | 282 | 1,036 | 1,263 |
Population Change Last Two Decades - Plus Projection
2000 | % | 2010 | % | 2020 | % | 2030 | |
---|---|---|---|---|---|---|---|
Ohio | 11,353,140 | +2 | 11,536,504 | 0 | 11,574,870 | 0 | 11,615,100 |
Ashtabula County | 102,728 | -1 | 101,497 | -6 | 95,160 | -6 | 89,760 |
Total Working Age Population:
Total Households:
Total Working Age Population:
Total Households:
Total Working Age Population:
Total Households: