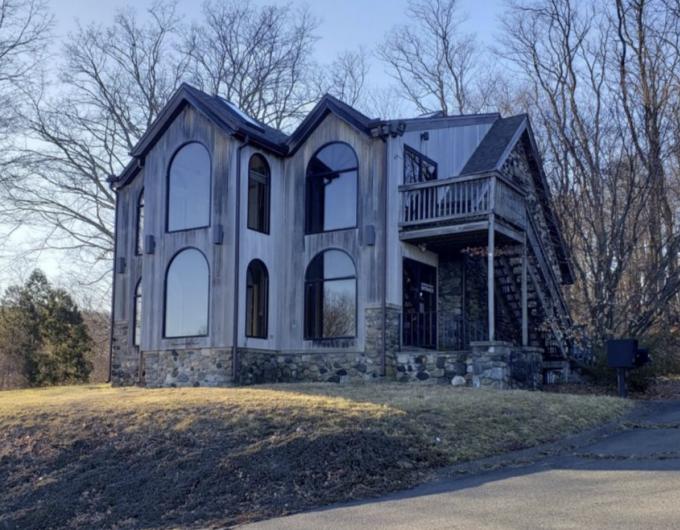
1-Mile | 3-Miles | 5-Miles | ||
---|---|---|---|---|
Total Population | 7,663 | 84,667 | 151,433 | |
Population Median Age | 39 | 38 | 38 | |
Population by Age | 0-9 Yrs | 948 (12%) | 12156 (14%) | 19669 (12%) |
10-19 Yrs | 911 (11%) | 10855 (12%) | 19374 (12%) | |
20-29 Yrs | 1037 (13%) | 11889 (14%) | 21287 (14%) | |
30-39 Yrs | 859 (11%) | 10596 (12%) | 18886 (12%) | |
40-49 Yrs | 1125 (14%) | 10727 (12%) | 19550 (12%) | |
50-59 Yrs | 1113 (14%) | 11108 (13%) | 20709 (13%) | |
60-69 Yrs | 999 (13%) | 9127 (10%) | 16298 (10%) | |
70+ Yrs | 671 (8%) | 8208 (9%) | 15659 (10%) | |
Median HH Income | $40,866 | $42,957 | $53,922 | |
Total Household Income | < 24K | 975 (31%) | 10329 (32%) | 14274 (25%) |
25-49K | 947 (30%) | 7496 (23%) | 12488 (21%) | |
50-74K | 392 (12%) | 5177 (16%) | 9015 (15%) | |
75-99K | 317 (10%) | 3340 (10%) | 7189 (12%) | |
100-199K | 394 (12%) | 4923 (15%) | 11623 (20%) | |
200K+ | 77 (2%) | 761 (2%) | 2402 (4%) | |
Highest Education Level | No Diploma | 838 | 11575 | 16542 |
Diploma or GED | 2023 | 20339 | 35962 | |
Some College | 1126 | 10799 | 19792 | |
Assoc. Degree | 459 | 4124 | 8286 | |
Bachelors Degree | 573 | 5443 | 12501 | |
Higher Degree | 182 | 3365 | 8466 | |
Total Housing Units | 3,648 | 37,568 | 65,006 | |
--Owner-Occupied | 1,491 | 13,080 | 30,122 | |
--Renter-Occupied | 1,611 | 18,946 | 26,869 | |
Owner-Occupied Values | < 100K | 353 | 2640 | 4912 |
100-199K | 805 | 6605 | 13559 | |
200-299K | 219 | 2344 | 6872 | |
300-399K | 72 | 942 | 2904 | |
400-499K | 1 | 295 | 1129 | |
500K+ | 41 | 253 | 746 | |
Total Working Age Population | 6,143 | 65,869 | 120,030 | |
In Work Force | 3,521 | 39,731 | 76,373 | |
Not In Work Force | 2,622 | 26,138 | 43,656 | |
Workforce Employed | 3,198 | 35,921 | 70,390 | |
Workforce Unemployed | 323 | 3,805 | 5,918 | |
Civlian Workforce | 3,521 | 39,726 | 76,308 | |
Military Workforce | 0 | 5 | 65 | |
Total Households | 3,102 | 32,027 | 56,991 | |
Family Households | 1,890 | 19,631 | 36,568 | |
Non-Family Households | 1,212 | 12,395 | 20,423 | |
Married Couple | 1,212 | 10,540 | 22,199 | |
Other Family | 677 | 9,091 | 14,369 | |
Married w/Child | 420 | 4,104 | 8,502 | |
Single Male w/Child | 97 | 693 | 1,275 | |
Single Female w/Child | 319 | 4,310 | 6,412 |
Population Change Last Two Decades - Plus Projection
2000 | % | 2010 | % | 2020 | % | 2030 | |
---|---|---|---|---|---|---|---|
Connecticut | 3,405,565 | +5 | 3,574,097 | +1 | 3,604,603 | +1 | 3,633,994 |
Fairfield County | 882,567 | +4 | 916,829 | -1 | 907,603 | -1 | 897,553 |
Hartford County | 857,183 | +4 | 894,014 | +2 | 909,671 | +2 | 930,629 |
Litchfield County | 182,193 | +4 | 189,927 | -2 | 186,611 | -3 | 180,866 |
New Haven County | 824,008 | +5 | 862,477 | +1 | 873,659 | +2 | 891,371 |
Total Working Age Population:
Total Households:
Total Working Age Population:
Total Households:
Total Working Age Population:
Total Households: