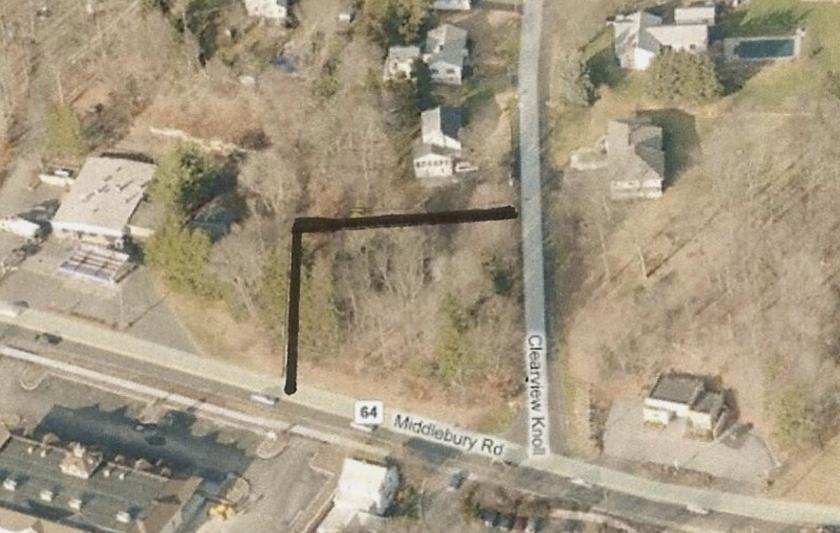
1-Mile | 3-Miles | 5-Miles | ||
---|---|---|---|---|
Total Population | 2,581 | 36,968 | 130,969 | |
Population Median Age | 46 | 40 | 38 | |
Population by Age | 0-9 Yrs | 123 (4%) | 4320 (11%) | 16371 (12%) |
10-19 Yrs | 370 (14%) | 4436 (11%) | 16881 (12%) | |
20-29 Yrs | 227 (8%) | 5806 (15%) | 19076 (14%) | |
30-39 Yrs | 304 (11%) | 4220 (11%) | 16462 (12%) | |
40-49 Yrs | 316 (12%) | 4600 (12%) | 16697 (12%) | |
50-59 Yrs | 420 (16%) | 5208 (14%) | 17866 (13%) | |
60-69 Yrs | 334 (12%) | 3920 (10%) | 14152 (10%) | |
70+ Yrs | 487 (18%) | 4460 (12%) | 13464 (10%) | |
Median HH Income | $104,433 | $69,858 | $54,127 | |
Total Household Income | < 24K | 114 (12%) | 2359 (17%) | 12140 (24%) |
25-49K | 115 (12%) | 2923 (21%) | 11205 (22%) | |
50-74K | 109 (11%) | 2020 (14%) | 7528 (15%) | |
75-99K | 94 (10%) | 1893 (13%) | 5872 (11%) | |
100-199K | 397 (42%) | 3391 (24%) | 9932 (20%) | |
200K+ | 97 (10%) | 1251 (9%) | 2905 (5%) | |
Highest Education Level | No Diploma | 194 | 2761 | 14290 |
Diploma or GED | 407 | 8076 | 29215 | |
Some College | 398 | 4736 | 16887 | |
Assoc. Degree | 197 | 1798 | 7200 | |
Bachelors Degree | 480 | 4372 | 11711 | |
Higher Degree | 302 | 3501 | 8933 | |
Total Housing Units | 1,005 | 15,338 | 56,547 | |
--Owner-Occupied | 762 | 9,288 | 26,619 | |
--Renter-Occupied | 163 | 4,549 | 22,962 | |
Owner-Occupied Values | < 100K | 16 | 1336 | 4464 |
100-199K | 105 | 3581 | 10855 | |
200-299K | 331 | 2366 | 6285 | |
300-399K | 174 | 983 | 2647 | |
400-499K | 65 | 435 | 1097 | |
500K+ | 70 | 586 | 1273 | |
Total Working Age Population | 2,222 | 30,085 | 104,285 | |
In Work Force | 1,529 | 20,096 | 67,548 | |
Not In Work Force | 694 | 9,989 | 36,737 | |
Workforce Employed | 1,453 | 18,778 | 62,033 | |
Workforce Unemployed | 74 | 1,291 | 5,442 | |
Civlian Workforce | 1,527 | 20,069 | 67,475 | |
Military Workforce | 2 | 27 | 72 | |
Total Households | 925 | 13,837 | 49,581 | |
Family Households | 612 | 9,182 | 31,829 | |
Non-Family Households | 313 | 4,655 | 17,752 | |
Married Couple | 491 | 6,337 | 19,535 | |
Other Family | 120 | 2,845 | 12,294 | |
Married w/Child | 185 | 2,349 | 7,665 | |
Single Male w/Child | 2 | 368 | 1,115 | |
Single Female w/Child | 4 | 965 | 5,167 |
Population Change Last Two Decades - Plus Projection
2000 | % | 2010 | % | 2020 | % | 2030 | |
---|---|---|---|---|---|---|---|
Connecticut | 3,405,565 | +5 | 3,574,097 | +1 | 3,604,603 | +1 | 3,633,994 |
Fairfield County | 882,567 | +4 | 916,829 | -1 | 907,603 | -1 | 897,553 |
Hartford County | 857,183 | +4 | 894,014 | +2 | 909,671 | +2 | 930,629 |
Litchfield County | 182,193 | +4 | 189,927 | -2 | 186,611 | -3 | 180,866 |
New Haven County | 824,008 | +5 | 862,477 | +1 | 873,659 | +2 | 891,371 |
Total Working Age Population:
Total Households:
Total Working Age Population:
Total Households:
Total Working Age Population:
Total Households: