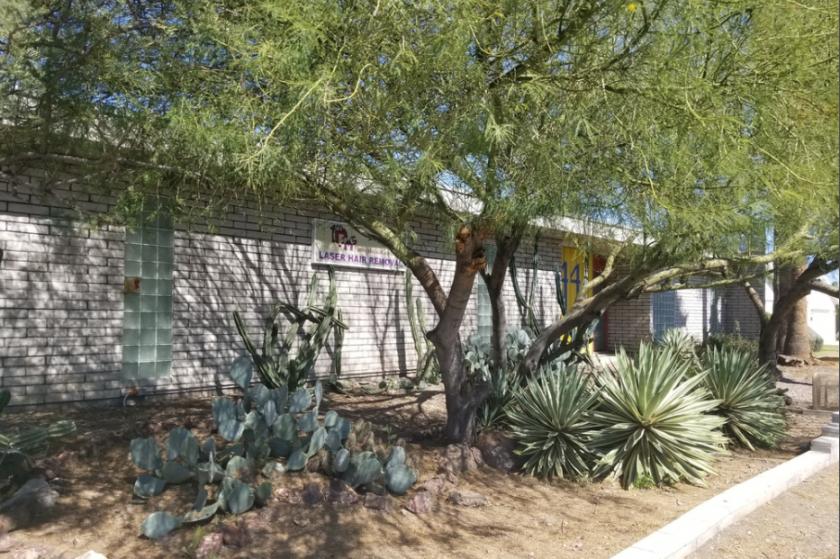
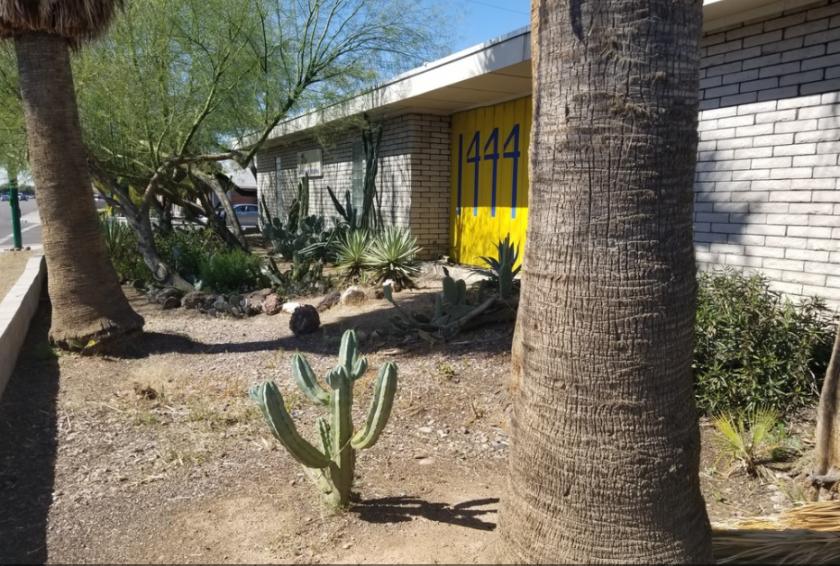
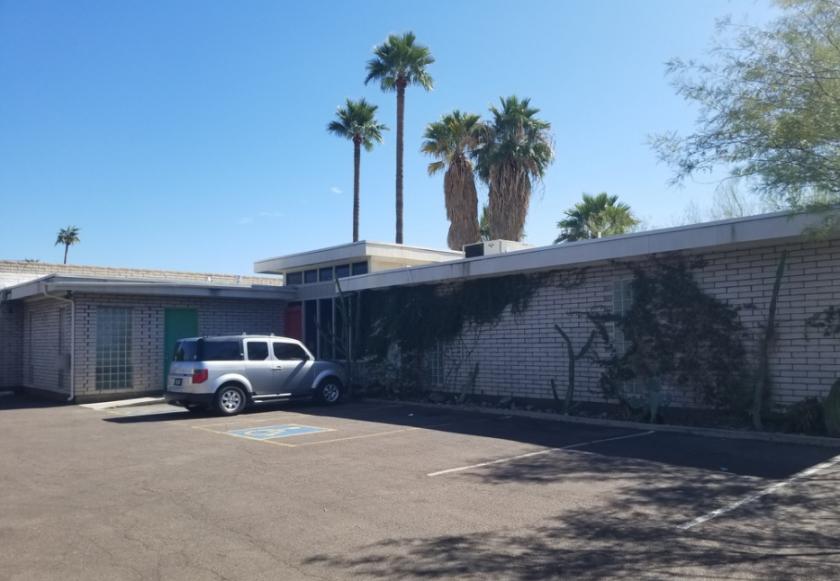
1-Mile | 3-Miles | 5-Miles | ||
---|---|---|---|---|
Total Population | 21,148 | 195,871 | 446,931 | |
Population Median Age | 36 | 36 | 36 | |
Population by Age | 0-9 Yrs | 3246 (15%) | 28760 (14%) | 63353 (14%) |
10-19 Yrs | 2458 (11%) | 25372 (12%) | 60000 (13%) | |
20-29 Yrs | 3242 (15%) | 31035 (15%) | 72102 (16%) | |
30-39 Yrs | 3441 (16%) | 30902 (15%) | 67937 (15%) | |
40-49 Yrs | 2330 (11%) | 25106 (12%) | 57120 (12%) | |
50-59 Yrs | 2457 (11%) | 21903 (11%) | 52264 (11%) | |
60-69 Yrs | 2189 (10%) | 18113 (9%) | 40446 (9%) | |
70+ Yrs | 1787 (8%) | 14679 (7%) | 33709 (7%) | |
Median HH Income | $47,331 | $47,415 | $46,475 | |
Total Household Income | < 24K | 2267 (27%) | 20800 (27%) | 45358 (27%) |
25-49K | 2151 (26%) | 19204 (25%) | 43642 (26%) | |
50-74K | 1151 (13%) | 13440 (17%) | 29573 (17%) | |
75-99K | 778 (9%) | 7678 (10%) | 17412 (10%) | |
100-199K | 1351 (16%) | 10947 (14%) | 23313 (13%) | |
200K+ | 545 (6%) | 4012 (5%) | 7954 (4%) | |
Highest Education Level | No Diploma | 1773 | 22234 | 59867 |
Diploma or GED | 3412 | 29512 | 71271 | |
Some College | 3099 | 28026 | 62034 | |
Assoc. Degree | 1329 | 9846 | 20812 | |
Bachelors Degree | 2635 | 23416 | 47721 | |
Higher Degree | 1875 | 14997 | 28590 | |
Total Housing Units | 9,149 | 84,975 | 189,049 | |
--Owner-Occupied | 3,881 | 31,998 | 74,410 | |
--Renter-Occupied | 4,363 | 44,084 | 92,842 | |
Owner-Occupied Values | < 100K | 279 | 3873 | 11613 |
100-199K | 1021 | 9975 | 24840 | |
200-299K | 910 | 6973 | 16472 | |
300-399K | 757 | 4468 | 8276 | |
400-499K | 387 | 2530 | 4646 | |
500K+ | 528 | 4179 | 8563 | |
Total Working Age Population | 16,353 | 151,477 | 347,823 | |
In Work Force | 10,752 | 100,865 | 227,005 | |
Not In Work Force | 5,601 | 50,612 | 120,818 | |
Workforce Employed | 9,869 | 94,578 | 212,243 | |
Workforce Unemployed | 882 | 6,224 | 14,624 | |
Civlian Workforce | 10,751 | 100,802 | 226,867 | |
Military Workforce | 2 | 63 | 137 | |
Total Households | 8,244 | 76,082 | 167,252 | |
Family Households | 4,829 | 39,785 | 90,511 | |
Non-Family Households | 3,415 | 36,298 | 76,741 | |
Married Couple | 2,792 | 23,308 | 53,873 | |
Other Family | 2,038 | 16,476 | 36,638 | |
Married w/Child | 1,264 | 10,877 | 24,074 | |
Single Male w/Child | 172 | 2,306 | 5,452 | |
Single Female w/Child | 910 | 6,968 | 15,115 |
Population Change Last Two Decades - Plus Projection
2000 | % | 2010 | % | 2020 | % | 2030 | |
---|---|---|---|---|---|---|---|
Arizona | 5,130,632 | +25 | 6,392,017 | +14 | 7,286,100 | +14 | 8,284,900 |
Maricopa County | 3,072,149 | +24 | 3,817,117 | +16 | 4,436,900 | +15 | 5,107,700 |
Pinal County | 179,727 | +109 | 375,770 | +24 | 466,200 | +32 | 616,200 |
Total Working Age Population:
Total Households:
Total Working Age Population:
Total Households:
Total Working Age Population:
Total Households: