Office Space
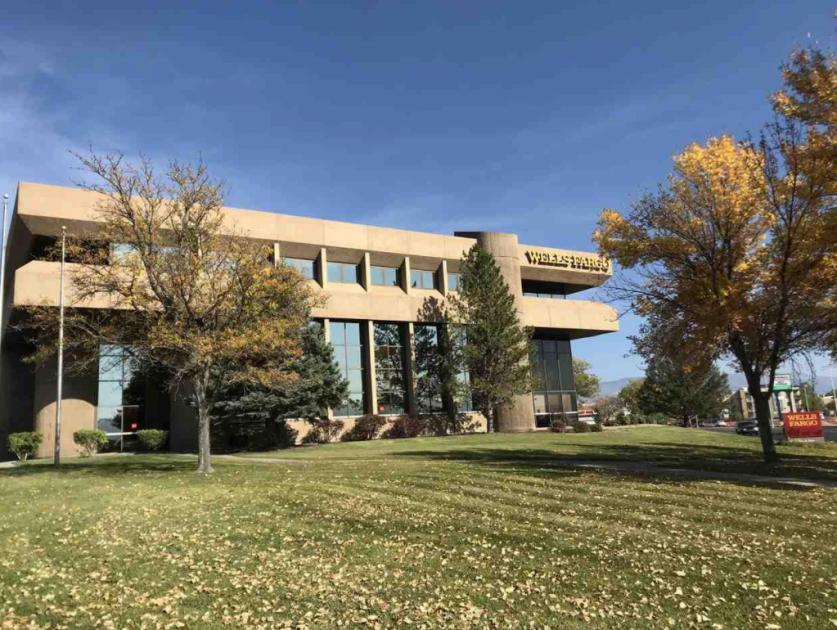
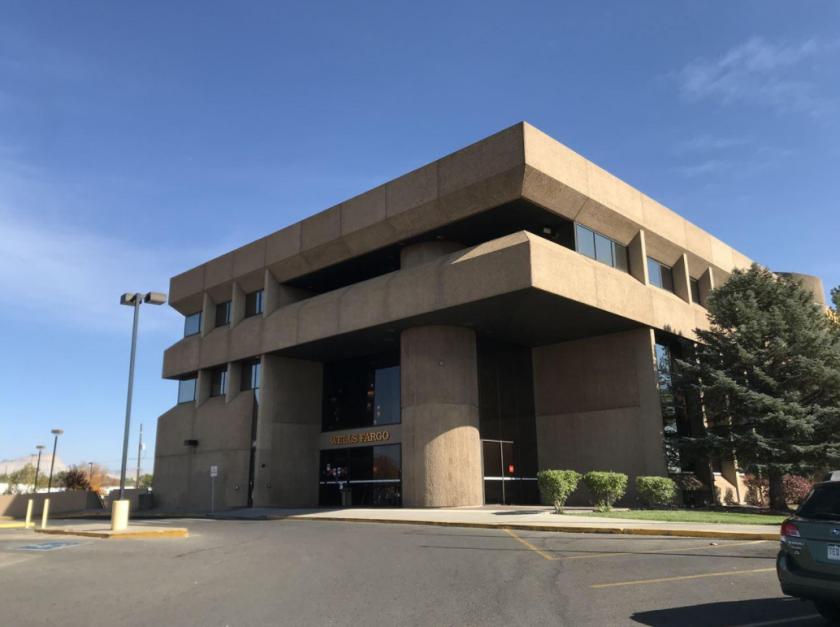
2808 North Avenue Grand Junction, CO 81501
2808 North Avenue Grand Junction, CO 81501
Details & Description
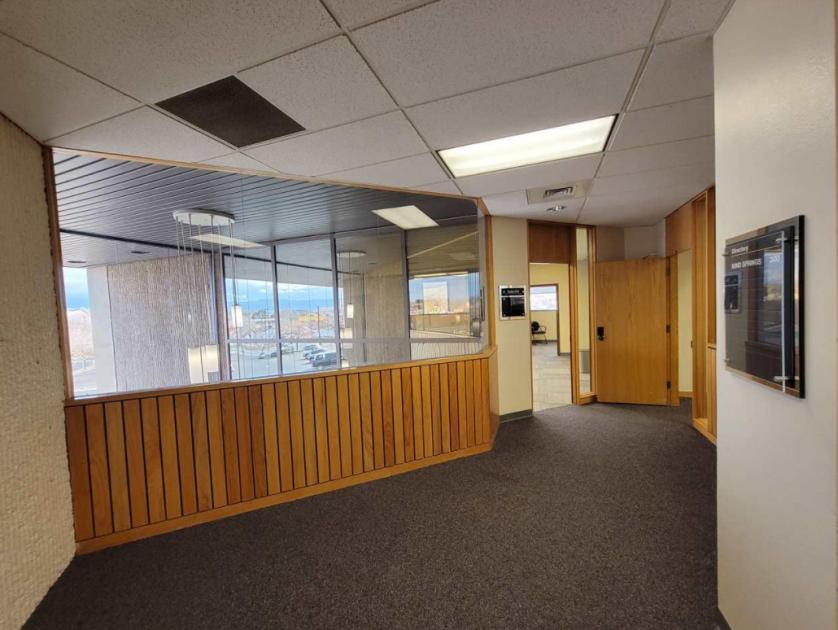
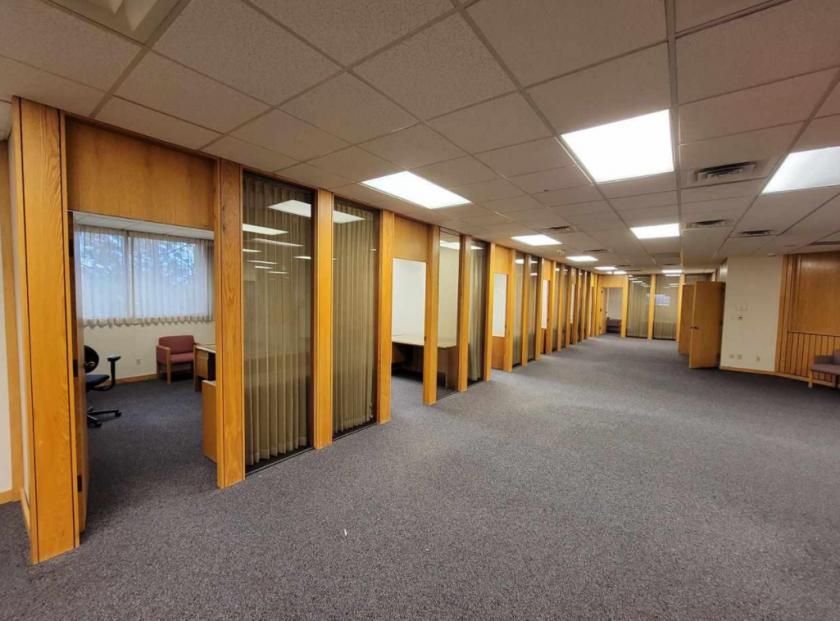
Additional Photos

Listing Agents

Brian Bray
O: 970-241-2909
M: 970-986-0446
brian@brayandco.com
O: 970-241-2909
M: 970-986-0446
brian@brayandco.com
While we strive to provide the most accurate information, all listing information, and demographic data, is provided by third-parties. As such, MyEListing will not be responsible for the accuracy of the information. It is strongly recommended that you verify all information with the listing agent, and any relevant agencies, prior to making any decisions.


