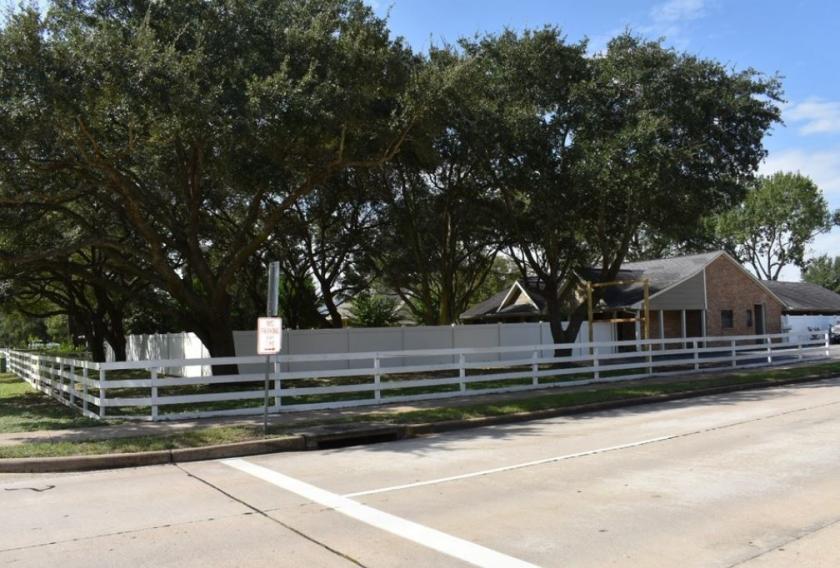
Retail Space
24811 Westheimer Parkway Katy, TX 77494
24811 Westheimer Parkway Katy, TX 77494

Details & Description
Property Highlights
- • Adjacent to Rylander Elementary
- • 342.55 of frontage on Westheimer Parkway
- • 110 depth
- • Fort Bend County Jurisdiction
- • Well Septic
- • Great morning and afternoon traffic
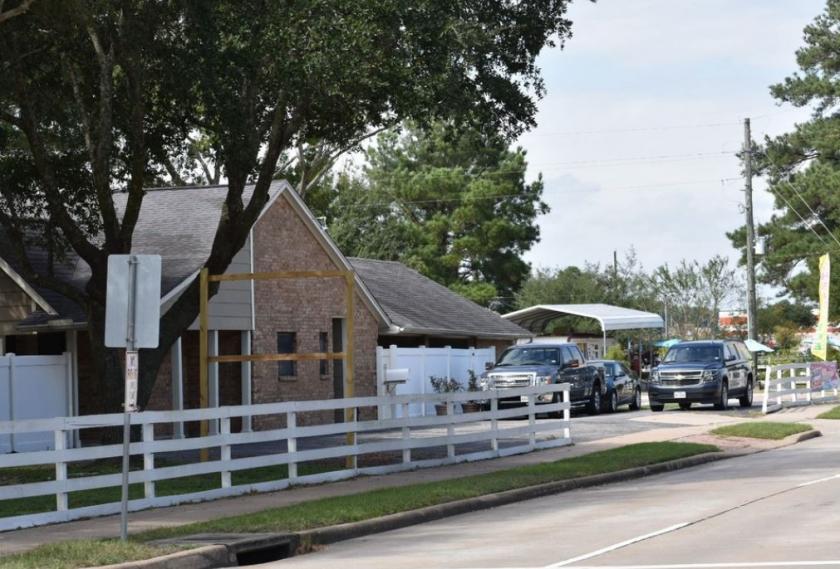
Additional Photos

Listing Agents

Wayne Landin
O: 713-470-2055
M: 713-202-3604
kwayne@kwcommercial.com
O: 713-470-2055
M: 713-202-3604
kwayne@kwcommercial.com
While we strive to provide the most accurate information, all listing information, and demographic data, is provided by third-parties. As such, MyEListing will not be responsible for the accuracy of the information. It is strongly recommended that you verify all information with the listing agent, and any relevant agencies, prior to making any decisions.


