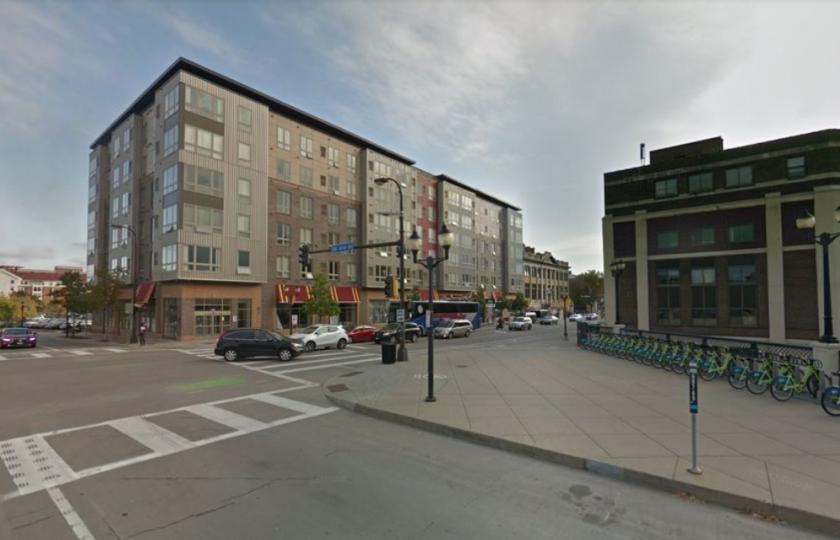
1-Mile | 3-Miles | 5-Miles | ||
---|---|---|---|---|
Total Population | 36,538 | 214,712 | 499,204 | |
Population Median Age | 26 | 34 | 36 | |
Population by Age | 0-9 Yrs | 2090 (5%) | 21660 (10%) | 56682 (11%) |
10-19 Yrs | 9644 (26%) | 24685 (11%) | 57702 (11%) | |
20-29 Yrs | 17496 (47%) | 61069 (28%) | 112049 (22%) | |
30-39 Yrs | 2844 (7%) | 37712 (17%) | 86533 (17%) | |
40-49 Yrs | 1417 (3%) | 19928 (9%) | 53373 (10%) | |
50-59 Yrs | 1244 (3%) | 19993 (9%) | 51943 (10%) | |
60-69 Yrs | 1151 (3%) | 17395 (8%) | 45465 (9%) | |
70+ Yrs | 652 (1%) | 12269 (5%) | 35456 (7%) | |
Median HH Income | $35,308 | $50,974 | $61,309 | |
Total Household Income | < 24K | 4101 (36%) | 26360 (28%) | 45371 (21%) |
25-49K | 2957 (26%) | 19918 (21%) | 43045 (20%) | |
50-74K | 1428 (12%) | 13782 (14%) | 34624 (16%) | |
75-99K | 875 (7%) | 10505 (11%) | 26465 (12%) | |
100-199K | 1344 (12%) | 17350 (18%) | 45595 (21%) | |
200K+ | 432 (3%) | 5819 (6%) | 15520 (7%) | |
Highest Education Level | No Diploma | 1006 | 15528 | 30635 |
Diploma or GED | 1405 | 20384 | 51620 | |
Some College | 1764 | 22808 | 55420 | |
Assoc. Degree | 559 | 9145 | 24008 | |
Bachelors Degree | 3816 | 40923 | 100592 | |
Higher Degree | 3049 | 28986 | 69902 | |
Total Housing Units | 11,729 | 100,370 | 223,912 | |
--Owner-Occupied | 1,570 | 30,346 | 97,329 | |
--Renter-Occupied | 9,565 | 63,389 | 113,291 | |
Owner-Occupied Values | < 100K | 111 | 1571 | 5572 |
100-199K | 422 | 7701 | 26156 | |
200-299K | 356 | 10294 | 32588 | |
300-399K | 224 | 5262 | 16629 | |
400-499K | 169 | 2351 | 7170 | |
500K+ | 287 | 3167 | 9215 | |
Total Working Age Population | 33,886 | 183,915 | 414,150 | |
In Work Force | 22,765 | 133,301 | 303,654 | |
Not In Work Force | 11,121 | 50,614 | 110,496 | |
Workforce Employed | 20,899 | 125,963 | 288,189 | |
Workforce Unemployed | 1,859 | 7,325 | 15,393 | |
Civlian Workforce | 22,758 | 133,289 | 303,582 | |
Military Workforce | 7 | 12 | 72 | |
Total Households | 11,136 | 93,735 | 210,621 | |
Family Households | 2,721 | 33,174 | 93,167 | |
Non-Family Households | 8,415 | 60,561 | 117,453 | |
Married Couple | 1,515 | 22,505 | 66,374 | |
Other Family | 1,206 | 10,669 | 26,793 | |
Married w/Child | 598 | 8,255 | 26,652 | |
Single Male w/Child | 90 | 1,186 | 3,315 | |
Single Female w/Child | 441 | 4,854 | 11,794 |
Population Change Last Two Decades - Plus Projection
2000 | % | 2010 | % | 2020 | % | 2030 | |
---|---|---|---|---|---|---|---|
Minnesota | 4,919,479 | +8 | 5,303,925 | +7 | 5,687,161 | +5 | 5,974,304 |
Anoka County | 298,084 | +11 | 330,844 | +8 | 358,469 | +6 | 380,651 |
Dakota County | 355,904 | +12 | 398,552 | +9 | 434,203 | +7 | 463,564 |
Hennepin County | 1,116,200 | +3 | 1,152,425 | +12 | 1,294,371 | +9 | 1,407,332 |
Ramsey County | 511,035 | 0 | 508,640 | +12 | 567,959 | +9 | 616,408 |
Total Working Age Population:
Total Households:
Total Working Age Population:
Total Households:
Total Working Age Population:
Total Households: