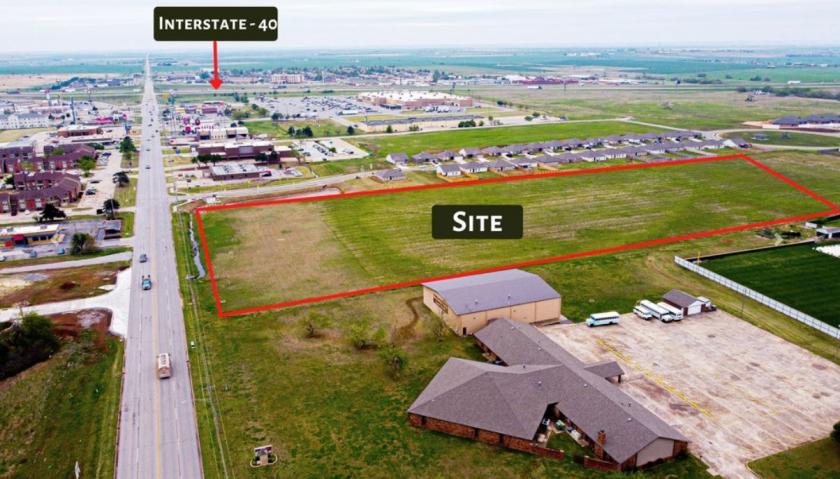
1-Mile | 3-Miles | 5-Miles | ||
---|---|---|---|---|
Total Population | 4,861 | 16,131 | 18,547 | |
Population Median Age | 39 | 37 | 37 | |
Population by Age | 0-9 Yrs | 652 (13%) | 2280 (14%) | 2567 (13%) |
10-19 Yrs | 329 (6%) | 1760 (10%) | 2093 (11%) | |
20-29 Yrs | 640 (13%) | 2370 (14%) | 2693 (14%) | |
30-39 Yrs | 1057 (21%) | 3078 (19%) | 3456 (18%) | |
40-49 Yrs | 619 (12%) | 1978 (12%) | 2272 (12%) | |
50-59 Yrs | 510 (10%) | 1790 (11%) | 2123 (11%) | |
60-69 Yrs | 587 (12%) | 1440 (8%) | 1696 (9%) | |
70+ Yrs | 468 (9%) | 1434 (8%) | 1647 (8%) | |
Median HH Income | $51,414 | $46,218 | $48,439 | |
Total Household Income | < 24K | 323 (18%) | 1165 (23%) | 1267 (22%) |
25-49K | 498 (29%) | 1480 (29%) | 1637 (28%) | |
50-74K | 414 (24%) | 993 (19%) | 1095 (19%) | |
75-99K | 193 (11%) | 613 (12%) | 713 (12%) | |
100-199K | 259 (15%) | 694 (13%) | 872 (15%) | |
200K+ | 28 (1%) | 56 (1%) | 87 (1%) | |
Highest Education Level | No Diploma | 381 | 1757 | 2087 |
Diploma or GED | 1480 | 4765 | 5368 | |
Some College | 794 | 2541 | 2916 | |
Assoc. Degree | 356 | 877 | 997 | |
Bachelors Degree | 370 | 920 | 1126 | |
Higher Degree | 185 | 376 | 422 | |
Total Housing Units | 1,898 | 5,873 | 6,629 | |
--Owner-Occupied | 1,032 | 2,793 | 3,300 | |
--Renter-Occupied | 684 | 2,208 | 2,370 | |
Owner-Occupied Values | < 100K | 365 | 1319 | 1477 |
100-199K | 559 | 1163 | 1387 | |
200-299K | 69 | 200 | 270 | |
300-399K | 33 | 52 | 77 | |
400-499K | 2 | 11 | 31 | |
500K+ | 3 | 48 | 57 | |
Total Working Age Population | 4,063 | 12,829 | 14,773 | |
In Work Force | 2,574 | 7,803 | 8,880 | |
Not In Work Force | 1,488 | 5,026 | 5,893 | |
Workforce Employed | 2,491 | 7,242 | 8,264 | |
Workforce Unemployed | 83 | 561 | 615 | |
Civlian Workforce | 2,574 | 7,803 | 8,879 | |
Military Workforce | 0 | 0 | 1 | |
Total Households | 1,716 | 5,001 | 5,670 | |
Family Households | 934 | 3,139 | 3,643 | |
Non-Family Households | 781 | 1,862 | 2,027 | |
Married Couple | 715 | 2,089 | 2,425 | |
Other Family | 219 | 1,050 | 1,218 | |
Married w/Child | 277 | 895 | 1,028 | |
Single Male w/Child | 17 | 175 | 195 | |
Single Female w/Child | 57 | 301 | 352 |
Population Change Last Two Decades - Plus Projection
2000 | % | 2010 | % | 2020 | % | 2030 | |
---|---|---|---|---|---|---|---|
Oklahoma | 3,450,654 | +9 | 3,751,351 | +7 | 4,024,202 | +7 | 4,302,501 |
Canadian County | 87,697 | +32 | 115,541 | +16 | 133,468 | +13 | 151,440 |
Total Working Age Population:
Total Households:
Total Working Age Population:
Total Households:
Total Working Age Population:
Total Households: