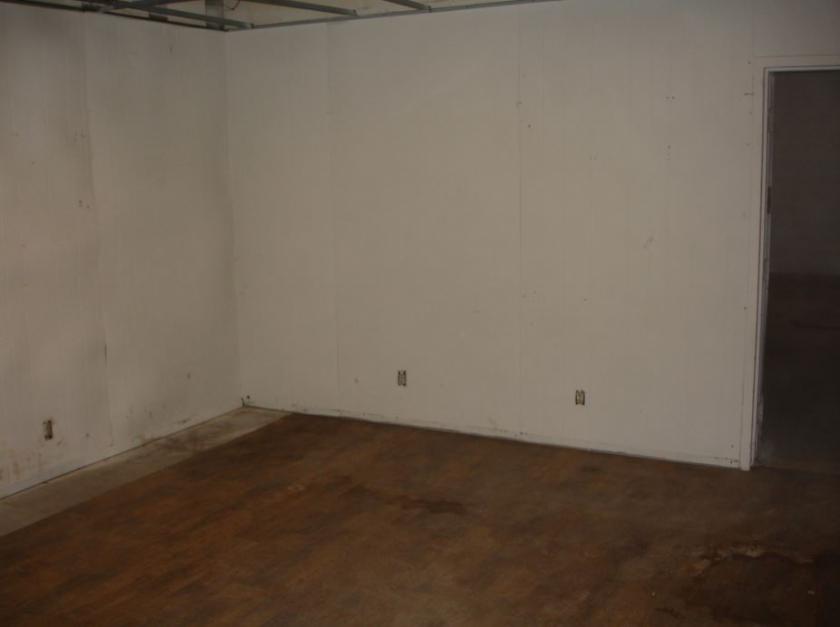
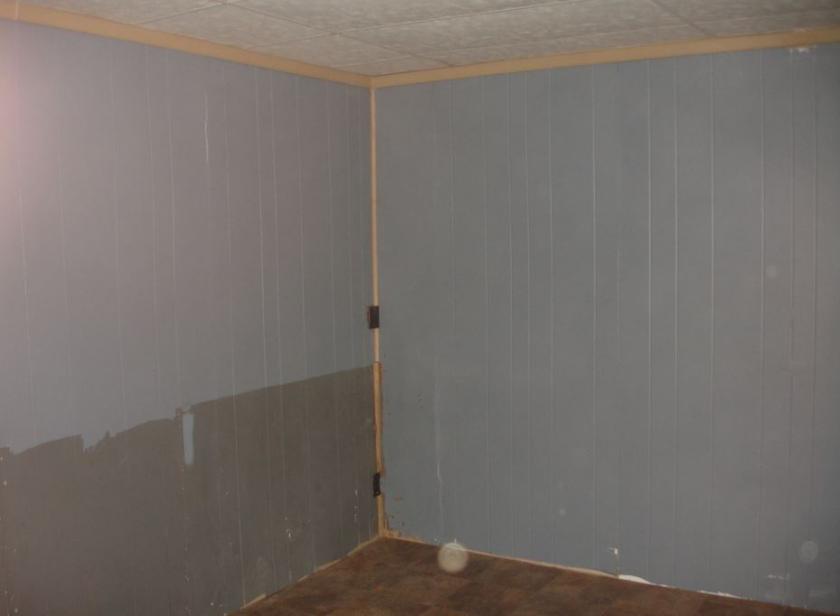
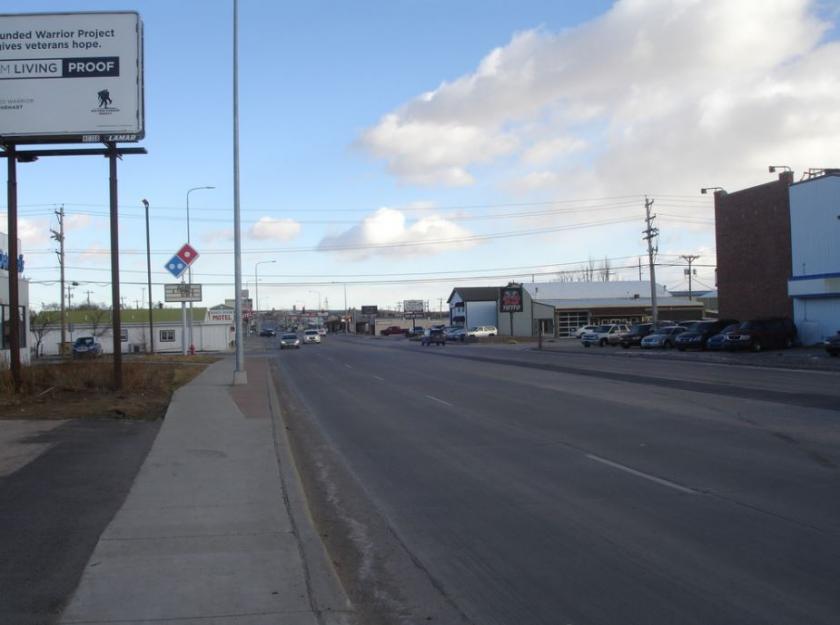
1-Mile | 3-Miles | 5-Miles | ||
---|---|---|---|---|
Total Population | 9,042 | 40,933 | 73,138 | |
Population Median Age | 35 | 38 | 38 | |
Population by Age | 0-9 Yrs | 1275 (14%) | 5563 (13%) | 10128 (13%) |
10-19 Yrs | 1235 (13%) | 5026 (12%) | 8842 (12%) | |
20-29 Yrs | 1841 (20%) | 6774 (16%) | 10886 (14%) | |
30-39 Yrs | 1126 (12%) | 5391 (13%) | 9518 (13%) | |
40-49 Yrs | 769 (8%) | 3984 (9%) | 7503 (10%) | |
50-59 Yrs | 1234 (13%) | 5216 (12%) | 9310 (12%) | |
60-69 Yrs | 846 (9%) | 4591 (11%) | 8981 (12%) | |
70+ Yrs | 715 (7%) | 4388 (10%) | 7971 (10%) | |
Median HH Income | $32,354 | $40,555 | $50,585 | |
Total Household Income | < 24K | 1364 (38%) | 4785 (29%) | 6858 (23%) |
25-49K | 1176 (33%) | 4810 (29%) | 7660 (26%) | |
50-74K | 656 (18%) | 3140 (19%) | 5972 (20%) | |
75-99K | 106 (2%) | 1510 (9%) | 3515 (11%) | |
100-199K | 226 (6%) | 1860 (11%) | 4432 (15%) | |
200K+ | 15 (0%) | 311 (1%) | 926 (3%) | |
Highest Education Level | No Diploma | 885 | 2773 | 3839 |
Diploma or GED | 1880 | 8425 | 14181 | |
Some College | 1554 | 6952 | 12063 | |
Assoc. Degree | 494 | 2831 | 5527 | |
Bachelors Degree | 552 | 4006 | 9173 | |
Higher Degree | 393 | 2278 | 4420 | |
Total Housing Units | 3,948 | 17,766 | 31,553 | |
--Owner-Occupied | 1,584 | 9,106 | 18,502 | |
--Renter-Occupied | 1,958 | 7,310 | 10,861 | |
Owner-Occupied Values | < 100K | 604 | 2113 | 3571 |
100-199K | 932 | 5024 | 8844 | |
200-299K | 33 | 1364 | 3674 | |
300-399K | 14 | 440 | 1471 | |
400-499K | 0 | 46 | 478 | |
500K+ | 0 | 118 | 464 | |
Total Working Age Population | 7,293 | 32,350 | 57,496 | |
In Work Force | 4,461 | 20,772 | 37,892 | |
Not In Work Force | 2,833 | 11,578 | 19,604 | |
Workforce Employed | 3,927 | 19,079 | 35,313 | |
Workforce Unemployed | 506 | 1,410 | 2,009 | |
Civlian Workforce | 4,433 | 20,490 | 37,322 | |
Military Workforce | 27 | 282 | 570 | |
Total Households | 3,542 | 16,416 | 29,363 | |
Family Households | 1,685 | 8,551 | 16,944 | |
Non-Family Households | 1,857 | 7,865 | 12,419 | |
Married Couple | 952 | 5,615 | 12,050 | |
Other Family | 733 | 2,936 | 4,894 | |
Married w/Child | 218 | 1,658 | 3,915 | |
Single Male w/Child | 117 | 390 | 654 | |
Single Female w/Child | 389 | 1,563 | 2,607 |
Population Change Last Two Decades - Plus Projection
2000 | % | 2010 | % | 2020 | % | 2030 | |
---|---|---|---|---|---|---|---|
South Dakota | 754,844 | +8 | 814,180 | +9 | 889,447 | +7 | 951,885 |
Meade County | 24,253 | +5 | 25,434 | +7 | 27,195 | +4 | 28,317 |
Pennington County | 88,565 | +14 | 100,948 | +13 | 114,161 | +10 | 125,154 |
Total Working Age Population:
Total Households:
Total Working Age Population:
Total Households:
Total Working Age Population:
Total Households: