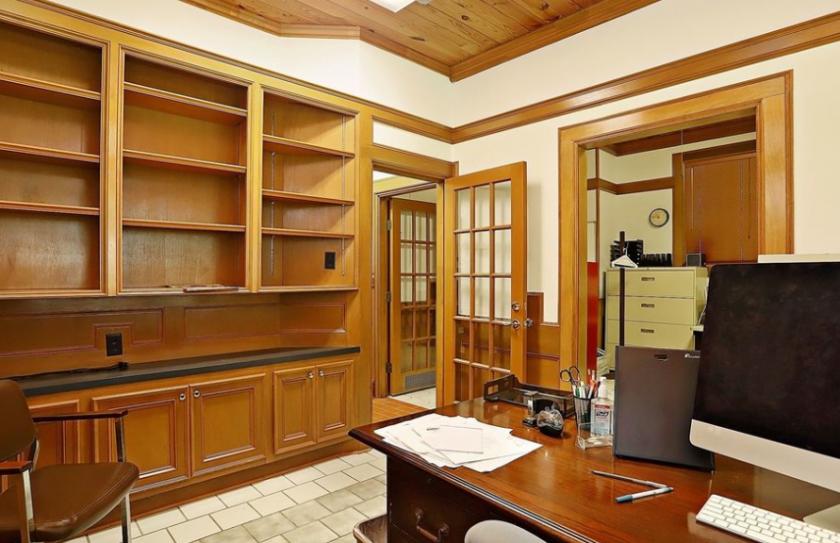
1-Mile | 3-Miles | 5-Miles | ||
---|---|---|---|---|
Total Population | 7,459 | 134,076 | 364,641 | |
Population Median Age | 39 | 34 | 34 | |
Population by Age | 0-9 Yrs | 1069 (14%) | 22985 (17%) | 59206 (16%) |
10-19 Yrs | 851 (11%) | 18795 (14%) | 50436 (13%) | |
20-29 Yrs | 995 (13%) | 18873 (14%) | 54996 (15%) | |
30-39 Yrs | 1148 (15%) | 20357 (15%) | 60865 (16%) | |
40-49 Yrs | 725 (9%) | 16711 (12%) | 45565 (12%) | |
50-59 Yrs | 954 (12%) | 15565 (11%) | 41719 (11%) | |
60-69 Yrs | 786 (10%) | 11565 (8%) | 30626 (8%) | |
70+ Yrs | 932 (12%) | 9225 (6%) | 21228 (5%) | |
Median HH Income | $42,682 | $42,260 | $45,796 | |
Total Household Income | < 24K | 892 (33%) | 13573 (29%) | 32983 (26%) |
25-49K | 554 (20%) | 12215 (26%) | 32991 (26%) | |
50-74K | 435 (16%) | 7110 (15%) | 19467 (15%) | |
75-99K | 300 (11%) | 4262 (9%) | 11599 (9%) | |
100-199K | 373 (14%) | 5945 (12%) | 17998 (14%) | |
200K+ | 87 (3%) | 2789 (6%) | 8994 (7%) | |
Highest Education Level | No Diploma | 1054 | 24133 | 71702 |
Diploma or GED | 1604 | 24275 | 61075 | |
Some College | 1061 | 13846 | 35150 | |
Assoc. Degree | 279 | 3985 | 10505 | |
Bachelors Degree | 654 | 11725 | 33853 | |
Higher Degree | 444 | 6191 | 18796 | |
Total Housing Units | 2,933 | 50,645 | 135,812 | |
--Owner-Occupied | 1,827 | 24,323 | 63,875 | |
--Renter-Occupied | 814 | 21,571 | 60,157 | |
Owner-Occupied Values | < 100K | 791 | 6886 | 17199 |
100-199K | 435 | 7972 | 21123 | |
200-299K | 319 | 2942 | 6981 | |
300-399K | 155 | 2414 | 6174 | |
400-499K | 56 | 1572 | 4738 | |
500K+ | 72 | 2537 | 7661 | |
Total Working Age Population | 5,866 | 99,297 | 273,920 | |
In Work Force | 3,219 | 63,641 | 181,752 | |
Not In Work Force | 2,647 | 35,656 | 92,168 | |
Workforce Employed | 3,010 | 59,737 | 172,532 | |
Workforce Unemployed | 209 | 3,879 | 9,156 | |
Civlian Workforce | 3,219 | 63,615 | 181,688 | |
Military Workforce | 0 | 25 | 64 | |
Total Households | 2,641 | 45,894 | 124,032 | |
Family Households | 1,707 | 30,544 | 81,869 | |
Non-Family Households | 934 | 15,350 | 42,163 | |
Married Couple | 837 | 17,641 | 50,071 | |
Other Family | 869 | 12,902 | 31,799 | |
Married w/Child | 302 | 8,466 | 23,147 | |
Single Male w/Child | 26 | 1,707 | 4,698 | |
Single Female w/Child | 222 | 5,030 | 12,948 |
Population Change Last Two Decades - Plus Projection
2000 | % | 2010 | % | 2020 | % | 2030 | |
---|---|---|---|---|---|---|---|
Texas | 20,851,820 | +21 | 25,145,561 | +18 | 29,677,668 | +18 | 34,894,452 |
Fort Bend County | 354,452 | +65 | 585,375 | +44 | 840,383 | +43 | 1,203,029 |
Harris County | 3,400,578 | +20 | 4,092,459 | +22 | 4,978,845 | +19 | 5,924,750 |
Total Working Age Population:
Total Households:
Total Working Age Population:
Total Households:
Total Working Age Population:
Total Households: