Industrial Properties
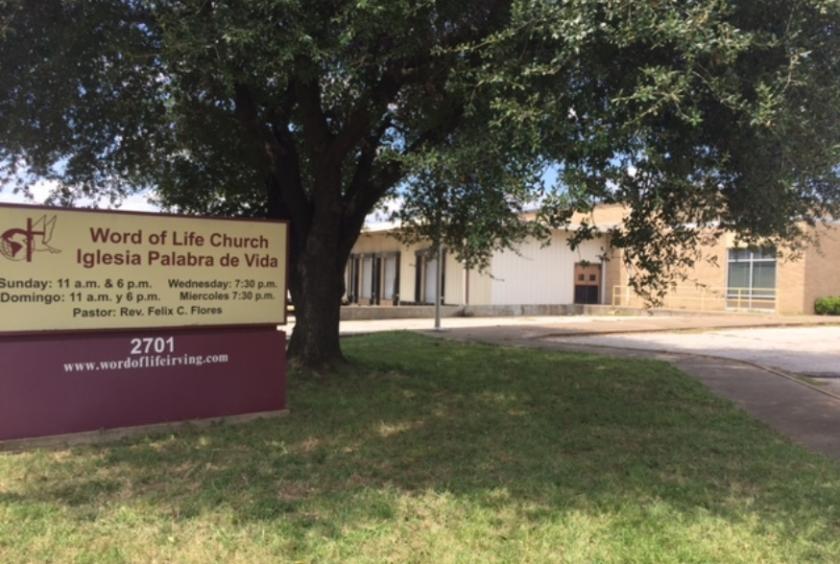
2701 William Brewster Drive Irving, TX 75062
2701 William Brewster Drive Irving, TX 75062
Details & Description
Property Highlights
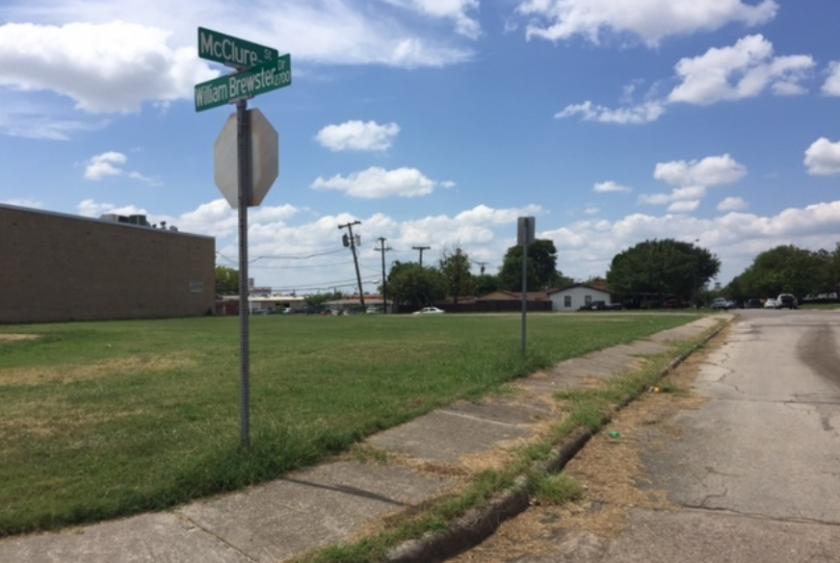
• Property occupies an entire block that fronts Rochelle Blvd in Irving, a major eastwest road.
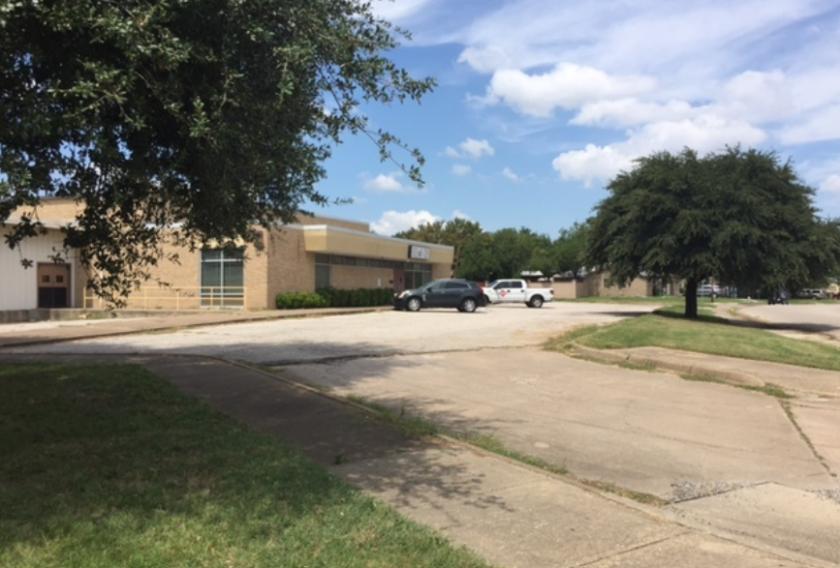
• Four full height docks, three with load levelers, plus a ramp for grade level deliveries.
Listing Agents

Cliff Bogart
O: 972-220-0144
M: 214-704-9862
cliff@vanguardcres.com
O: 972-220-0144
M: 214-704-9862
cliff@vanguardcres.com
While we strive to provide the most accurate information, all listing information, and demographic data, is provided by third-parties. As such, MyEListing will not be responsible for the accuracy of the information. It is strongly recommended that you verify all information with the listing agent, and any relevant agencies, prior to making any decisions.