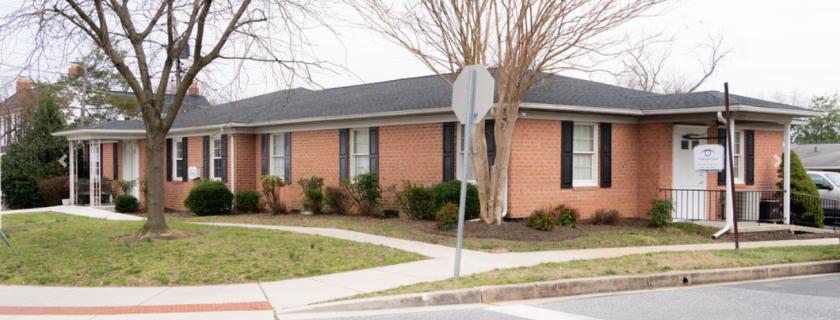
Office Space
1011 Frederick Road Catonsville, MD 21228
1011 Frederick Road Catonsville, MD 21228
Details & Description
Property Highlights
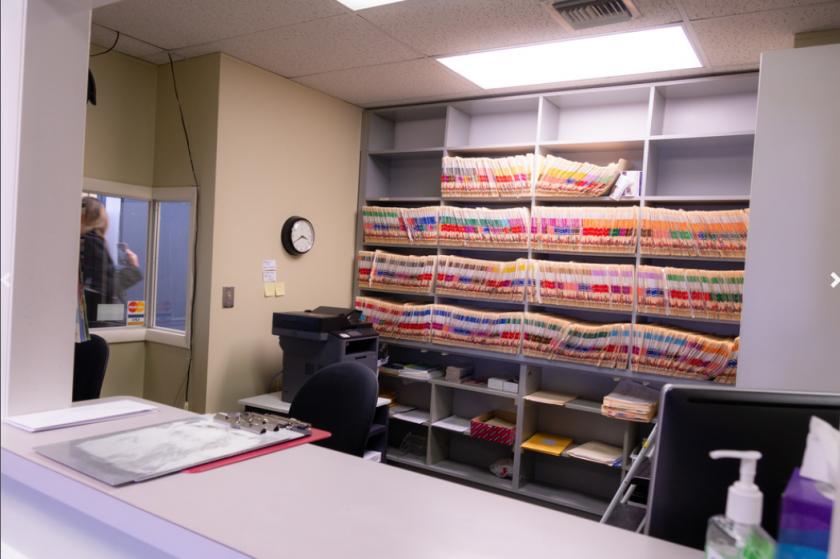
- • Used as a doctors office since 1999
- • Private off street parking lot off Beaumont Ave
- • Signage opportunity facing Frederick Rd
Listing Agents

Helen Dellheim
O: 410-312-0000
M: 410-258-4136
helen@wincommercial.com
O: 410-312-0000
M: 410-258-4136
helen@wincommercial.com
While we strive to provide the most accurate information, all listing information, and demographic data, is provided by third-parties. As such, MyEListing will not be responsible for the accuracy of the information. It is strongly recommended that you verify all information with the listing agent, and any relevant agencies, prior to making any decisions.