Specialty Real Estate
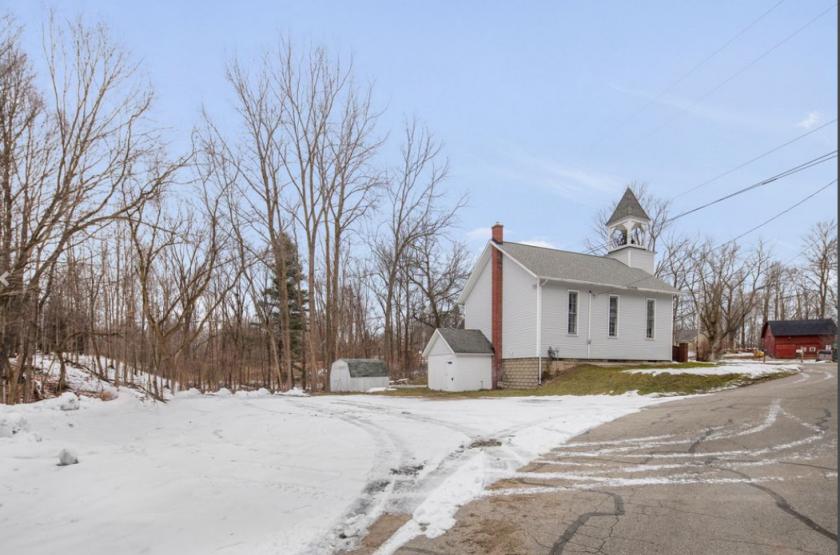
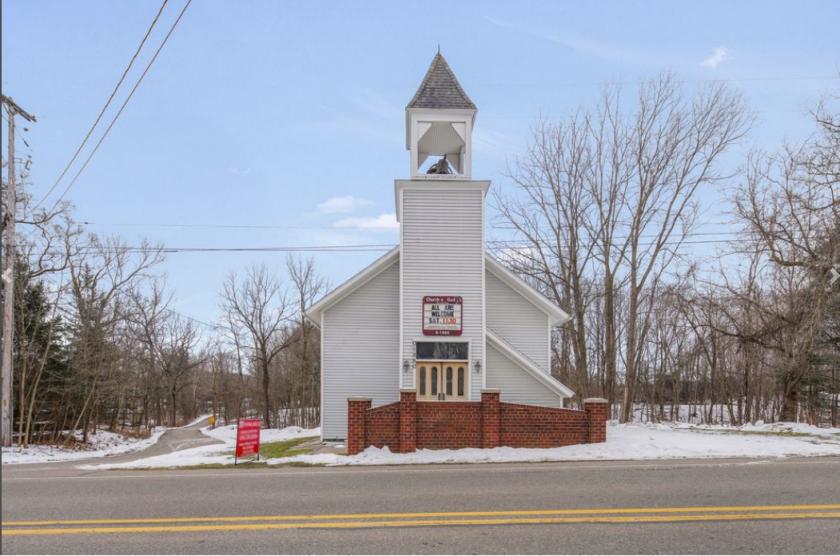
1880 Leonard Street Northwest Marne, MI 49435
1880 Leonard Street Northwest Marne, MI 49435
Details & Description
Property Highlights
- • Good traffic counts
- • Good residential conversion potential
- • Ample Parking
- • Newer roof and mechanicals
Listing Agents

Jason Carpenter
O: 616-334-2630
M: 616-334-2630
jcarpenter@kw.com
O: 616-334-2630
M: 616-334-2630
jcarpenter@kw.com
While we strive to provide the most accurate information, all listing information, and demographic data, is provided by third-parties. As such, MyEListing will not be responsible for the accuracy of the information. It is strongly recommended that you verify all information with the listing agent, and any relevant agencies, prior to making any decisions.