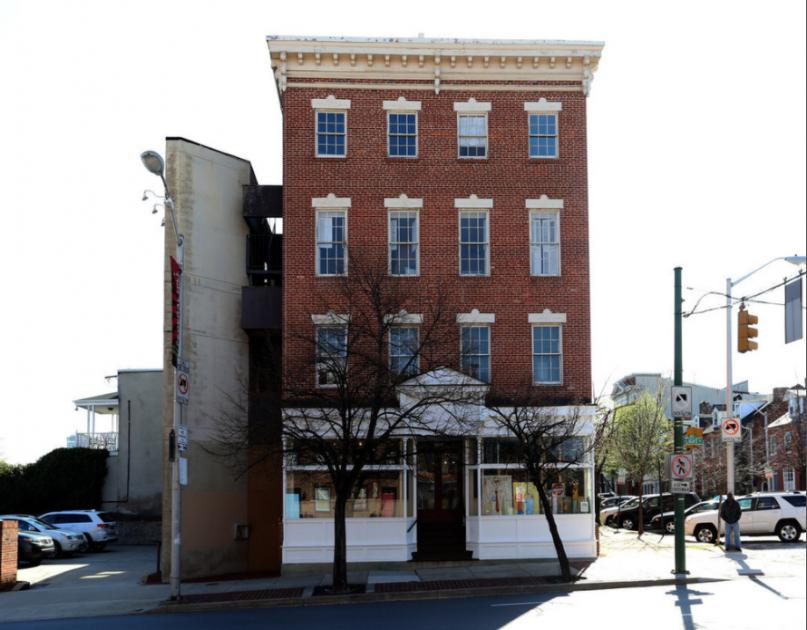
1-Mile | 3-Miles | 5-Miles | ||
---|---|---|---|---|
Total Population | 31,672 | 245,996 | 513,702 | |
Population Median Age | 37 | 36 | 37 | |
Population by Age | 0-9 Yrs | 2087 (6%) | 29097 (11%) | 62588 (12%) |
10-19 Yrs | 1481 (4%) | 23373 (9%) | 56190 (10%) | |
20-29 Yrs | 9554 (30%) | 49937 (20%) | 92941 (18%) | |
30-39 Yrs | 7898 (24%) | 48514 (19%) | 87757 (17%) | |
40-49 Yrs | 3027 (9%) | 25595 (10%) | 54918 (10%) | |
50-59 Yrs | 3168 (10%) | 29389 (11%) | 63438 (12%) | |
60-69 Yrs | 2443 (7%) | 23204 (9%) | 52894 (10%) | |
70+ Yrs | 2013 (6%) | 16887 (6%) | 42977 (8%) | |
Median HH Income | $90,818 | $52,310 | $50,551 | |
Total Household Income | < 24K | 2414 (15%) | 30741 (29%) | 55968 (27%) |
25-49K | 1880 (11%) | 19852 (19%) | 44709 (22%) | |
50-74K | 2589 (16%) | 15023 (14%) | 31703 (15%) | |
75-99K | 1743 (10%) | 9561 (9%) | 21695 (10%) | |
100-199K | 4687 (29%) | 19412 (18%) | 35784 (17%) | |
200K+ | 2659 (16%) | 9494 (9%) | 13119 (6%) | |
Highest Education Level | No Diploma | 1526 | 28479 | 56453 |
Diploma or GED | 2395 | 43885 | 105521 | |
Some College | 2594 | 26894 | 65123 | |
Assoc. Degree | 585 | 7049 | 16037 | |
Bachelors Degree | 9193 | 37529 | 61113 | |
Higher Degree | 8746 | 33884 | 53766 | |
Total Housing Units | 18,423 | 135,385 | 252,650 | |
--Owner-Occupied | 6,623 | 39,700 | 93,456 | |
--Renter-Occupied | 9,349 | 64,383 | 109,523 | |
Owner-Occupied Values | < 100K | 140 | 10316 | 24019 |
100-199K | 861 | 7866 | 31402 | |
200-299K | 1701 | 8222 | 18936 | |
300-399K | 1494 | 5846 | 8684 | |
400-499K | 795 | 3045 | 4253 | |
500K+ | 1633 | 4406 | 6163 | |
Total Working Age Population | 28,651 | 202,391 | 418,503 | |
In Work Force | 22,048 | 130,682 | 261,698 | |
Not In Work Force | 6,603 | 71,709 | 156,805 | |
Workforce Employed | 21,339 | 121,011 | 240,978 | |
Workforce Unemployed | 627 | 9,268 | 20,044 | |
Civlian Workforce | 21,967 | 130,279 | 261,022 | |
Military Workforce | 81 | 403 | 677 | |
Total Households | 15,972 | 104,083 | 202,979 | |
Family Households | 5,363 | 44,699 | 99,430 | |
Non-Family Households | 10,609 | 59,384 | 103,549 | |
Married Couple | 4,023 | 21,290 | 48,584 | |
Other Family | 1,340 | 23,409 | 50,846 | |
Married w/Child | 1,112 | 6,763 | 16,172 | |
Single Male w/Child | 98 | 1,916 | 4,041 | |
Single Female w/Child | 497 | 9,888 | 19,778 |
Population Change Last Two Decades - Plus Projection
2000 | % | 2010 | % | 2020 | % | 2030 | |
---|---|---|---|---|---|---|---|
Maryland | 5,296,486 | +9 | 5,773,552 | +6 | 6,141,900 | +6 | 6,518,750 |
Anne Arundel County | 489,656 | +10 | 537,656 | +7 | 573,250 | +4 | 596,700 |
Baltimore County | 754,292 | +7 | 805,029 | +5 | 847,000 | +2 | 862,200 |
Harford County | 218,590 | +12 | 244,826 | +5 | 257,700 | +5 | 271,850 |
Howard County | 247,842 | +16 | 287,085 | +17 | 336,900 | +9 | 366,800 |
Baltimore city | 651,154 | -5 | 620,961 | -1 | 616,300 | +1 | 625,100 |
Total Working Age Population:
Total Households:
Total Working Age Population:
Total Households:
Total Working Age Population:
Total Households: