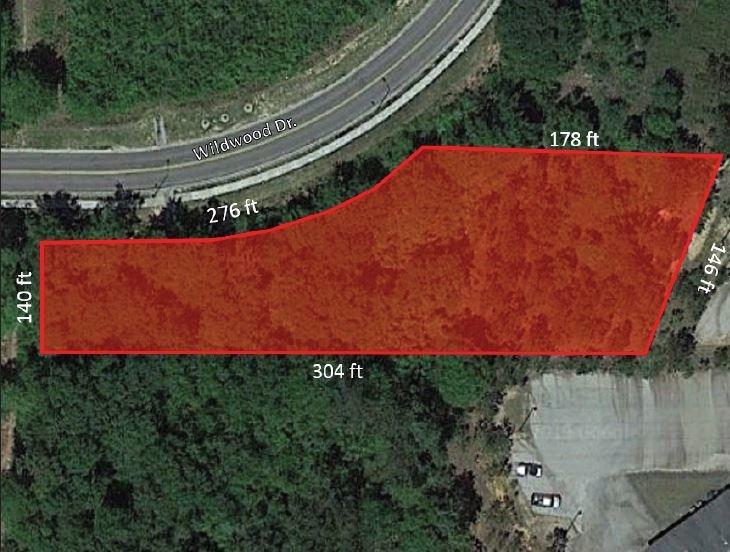
1-Mile | 3-Miles | 5-Miles | ||
---|---|---|---|---|
Total Population | 2,138 | 12,121 | 23,066 | |
Population Median Age | 39 | 41 | 40 | |
Population by Age | 0-9 Yrs | 334 (15%) | 1283 (10%) | 2752 (11%) |
10-19 Yrs | 328 (15%) | 1798 (14%) | 3223 (13%) | |
20-29 Yrs | 171 (7%) | 1516 (12%) | 2931 (12%) | |
30-39 Yrs | 324 (15%) | 1370 (11%) | 2364 (10%) | |
40-49 Yrs | 168 (7%) | 1340 (11%) | 2578 (11%) | |
50-59 Yrs | 208 (9%) | 1457 (12%) | 2870 (12%) | |
60-69 Yrs | 255 (11%) | 1765 (14%) | 3432 (14%) | |
70+ Yrs | 351 (16%) | 1591 (13%) | 2917 (12%) | |
Median HH Income | $42,814 | $43,420 | $43,878 | |
Total Household Income | < 24K | 238 (28%) | 1483 (31%) | 2638 (29%) |
25-49K | 203 (24%) | 1079 (22%) | 2139 (24%) | |
50-74K | 150 (18%) | 774 (16%) | 1475 (16%) | |
75-99K | 71 (8%) | 403 (8%) | 815 (9%) | |
100-199K | 129 (15%) | 841 (17%) | 1524 (17%) | |
200K+ | 33 (4%) | 194 (4%) | 318 (3%) | |
Highest Education Level | No Diploma | 181 | 1240 | 2510 |
Diploma or GED | 421 | 2364 | 4722 | |
Some College | 340 | 2183 | 4084 | |
Assoc. Degree | 145 | 945 | 1752 | |
Bachelors Degree | 197 | 988 | 1726 | |
Higher Degree | 137 | 520 | 834 | |
Total Housing Units | 949 | 5,671 | 10,556 | |
--Owner-Occupied | 505 | 2,990 | 6,062 | |
--Renter-Occupied | 319 | 1,783 | 2,847 | |
Owner-Occupied Values | < 100K | 98 | 903 | 2068 |
100-199K | 272 | 1260 | 2397 | |
200-299K | 74 | 538 | 1099 | |
300-399K | 59 | 213 | 334 | |
400-499K | 2 | 45 | 83 | |
500K+ | 0 | 32 | 82 | |
Total Working Age Population | 1,574 | 9,693 | 18,362 | |
In Work Force | 812 | 5,064 | 9,562 | |
Not In Work Force | 762 | 4,628 | 8,800 | |
Workforce Employed | 799 | 4,721 | 8,726 | |
Workforce Unemployed | 13 | 343 | 836 | |
Civlian Workforce | 812 | 5,064 | 9,562 | |
Military Workforce | 0 | 0 | 0 | |
Total Households | 824 | 4,774 | 8,910 | |
Family Households | 612 | 3,311 | 6,254 | |
Non-Family Households | 212 | 1,462 | 2,656 | |
Married Couple | 384 | 2,133 | 4,244 | |
Other Family | 227 | 1,178 | 2,010 | |
Married w/Child | 155 | 723 | 1,390 | |
Single Male w/Child | 6 | 106 | 242 | |
Single Female w/Child | 165 | 596 | 953 |
Population Change Last Two Decades - Plus Projection
2000 | % | 2010 | % | 2020 | % | 2030 | |
---|---|---|---|---|---|---|---|
Louisiana | 4,468,976 | +1 | 4,533,372 | +1 | 4,588,310 | +5 | 4,813,420 |
St. Tammany Parish | 191,268 | +22 | 233,740 | +45 | 338,300 | +36 | 459,160 |
Mississippi | 2,844,658 | +4 | 2,967,297 | +3 | 3,066,382 | +1 | 3,104,159 |
Hancock County | 42,967 | +2 | 43,929 | +6 | 46,578 | +1 | 47,152 |
Pearl River County | 48,621 | +15 | 55,834 | +11 | 62,094 | +1 | 62,859 |
Total Working Age Population:
Total Households:
Total Working Age Population:
Total Households:
Total Working Age Population:
Total Households: