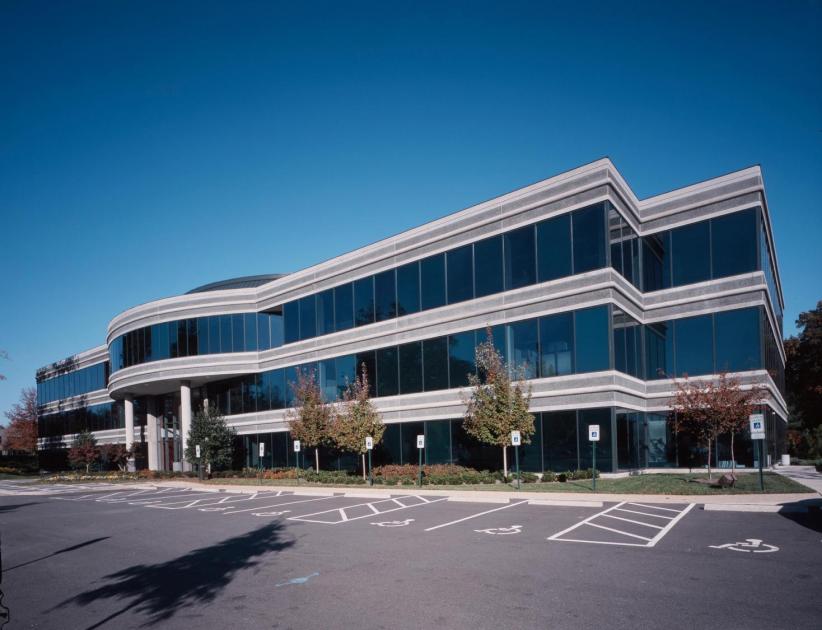
Arboretum VI is a three-story, 73,000 square foot Class A office building offering commanding lake views, granite and marble finishes and building conference facility; located within Chesterfield County’s most desirable office park.
Conveniently located in Chesterfield County at the intersection of Midlothian Turnpike (Rt. 60) and the Powhite Expressway (Rt. 76). Minutes from Richmond International Airport and downtown Richmond, with a wide selection of shopping, restaurants and service amenities.
Conference Room in Arboretum III – located on 5th floor, seats 40, screen, projector, white board and Wi-Fi. Conference phone is 804-330-5429. Click here to access conference room guidelines.
Conference Room in Arboretum VI – located 3rd floor, seats 12, screen white board and Wi-Fi. Conference phone is 804-323-8105. Click here to access conference room guidelines.
Conference Room in Arboretum I – located on 2nd floor, seats 12, screen, white board and Wi-Fi. Conference phone is 804-272-1816.
Arboretum Athletic Club – located on 1st floor of Arboretum III. Click here to obtain gym waiver in order to gain access to this facility.
LeBox Lunch – café in 1st floor atrium of 300 Arboretum Place; open Monday-Friday 7:00 AM – 2:00 PM; serves breakfast, lunch, snacks; catering available.
No part of this information may be copied, reproduced, repurposed, or screen-captured for any commercial purpose without prior written authorization from MyEListing.
While we strive to provide the most accurate information, all listing information, and demographic data, is provided by third-parties. As such, MyEListing will not be responsible for the accuracy of the information. It is strongly recommended that you verify all information with the listing agent, and any relevant agencies, prior to making any decisions.
What is the building size of this commercial Office property?
The size of this multi-unit property varies between 3439 - 10976 square feet
What kind of Office is the propery at 9011 Arboretum Parkway?
The property at 9011 Arboretum Parkway Richmond, VA 23236 is listed as a Professional Office property
What is the population within 1 mile of 9011 Arboretum Parkway in Richmond?
The population within 1 mile of 9011 Arboretum Parkway Richmond, VA 23236 is 6,203 people.
Who do I contact for questions about 9011 Arboretum Parkway?
You should contact the listing agent,
Joey Caperton, for any details regarding this commercial listing.