Flex-Office-Warehouse
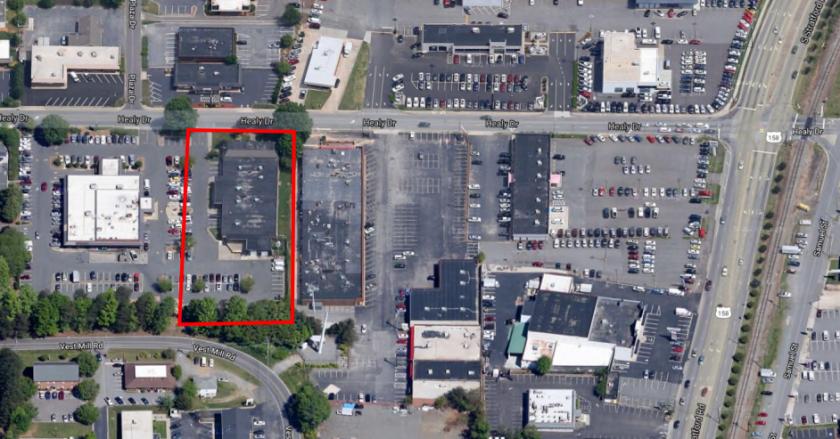
3250 Healy Drive WinstonSalem, NC 27103
3250 Healy Drive WinstonSalem, NC 27103
Details & Description
Property Highlights
- • - 1.01 Acres
- • 76 Parking Spaces
- • Flex property in a well tenanted office park
Listing Agents

Steve Ellis
O: 813-961-1812
steve.ellis@tscg.com
O: 813-961-1812
steve.ellis@tscg.com
While we strive to provide the most accurate information, all listing information, and demographic data, is provided by third-parties. As such, MyEListing will not be responsible for the accuracy of the information. It is strongly recommended that you verify all information with the listing agent, and any relevant agencies, prior to making any decisions.


