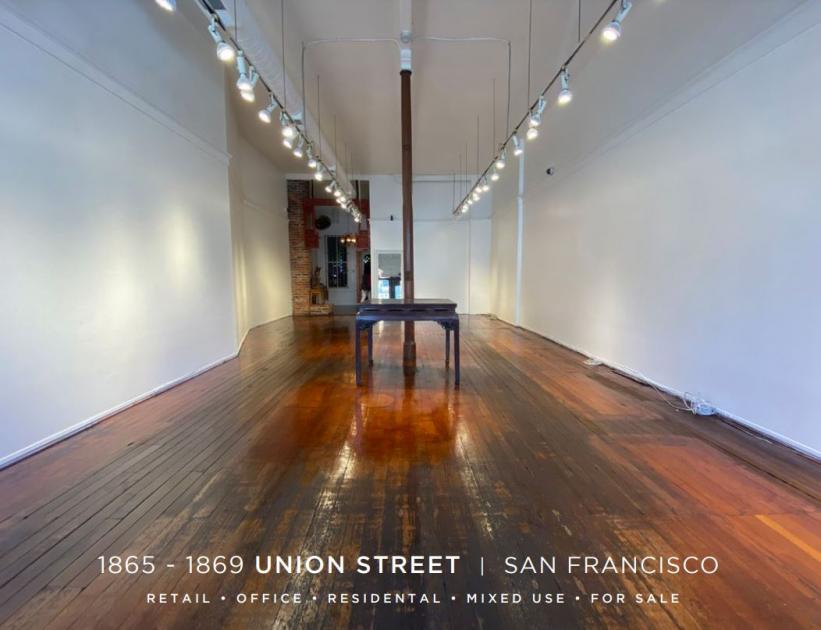
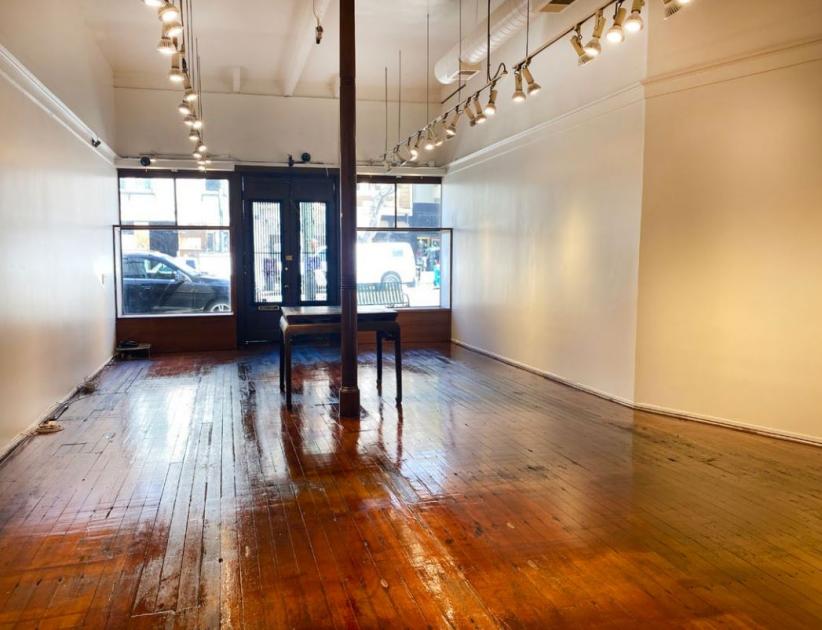
Retail Space
1865 Union Street San Francisco, CA 94123
1865 Union Street San Francisco, CA 94123
Details & Description
Property Highlights
- • Retail Unit Vacant for first time in 36 Years
- • ADU Potential
- • 2 Buildings on 1 Parcel
- • 4 Units Total non permitted garden studio
- • 2 Commercial 2 Residential
- • Desirable Union Street Location
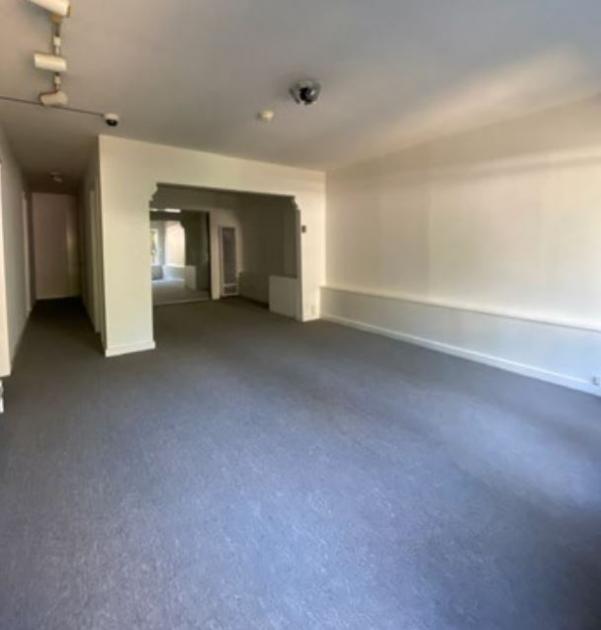
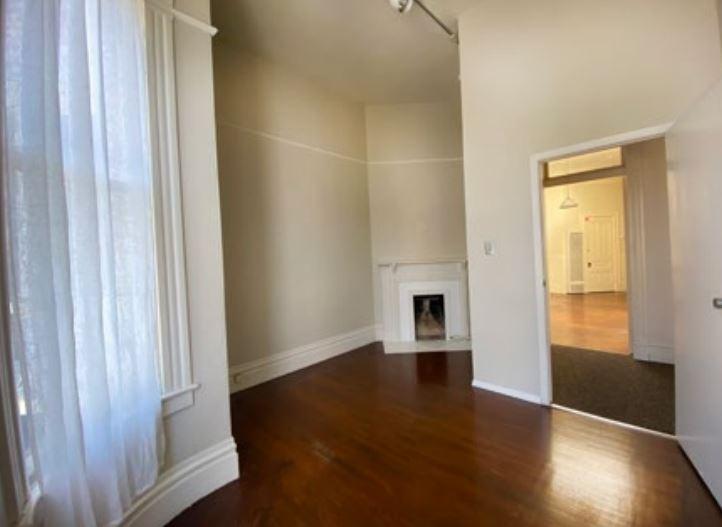
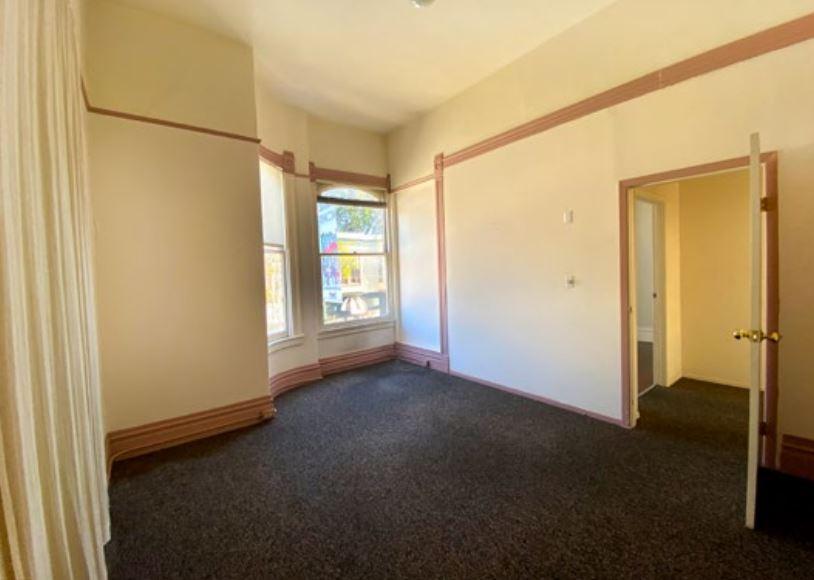
Additional Photos
Listing Agents

Dominic Morbidelli
O: 415-404-7314
M: 510-504-6432
dom@mavenproperties.com
O: 415-404-7314
M: 510-504-6432
dom@mavenproperties.com
While we strive to provide the most accurate information, all listing information, and demographic data, is provided by third-parties. As such, MyEListing will not be responsible for the accuracy of the information. It is strongly recommended that you verify all information with the listing agent, and any relevant agencies, prior to making any decisions.


