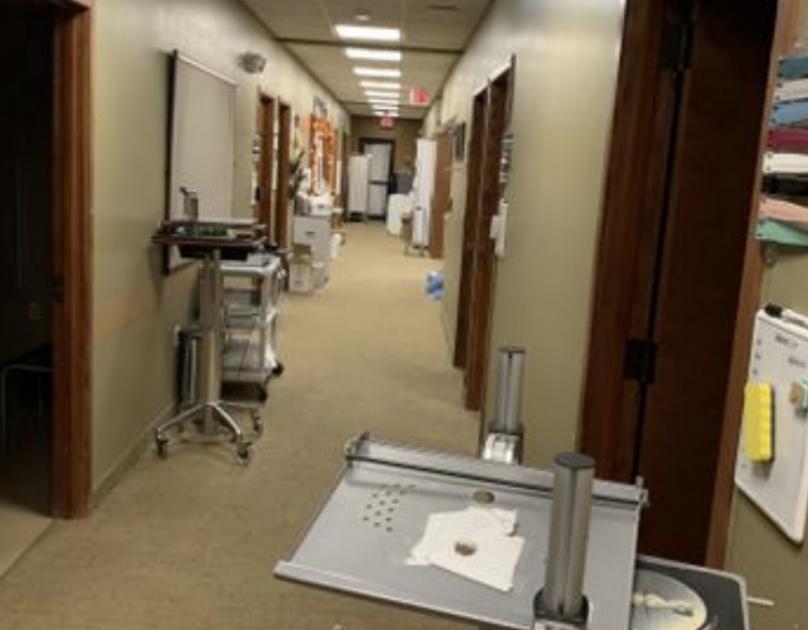
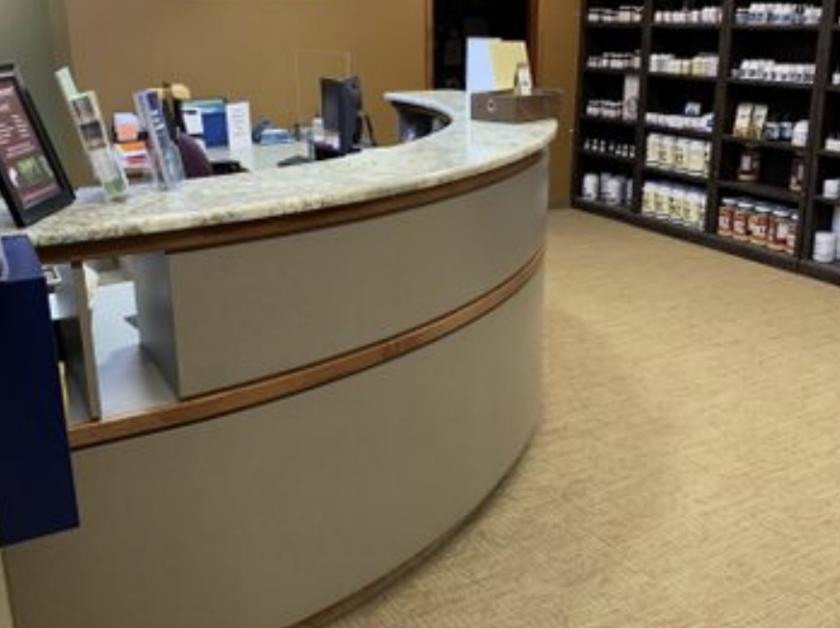
1-Mile | 3-Miles | 5-Miles | ||
---|---|---|---|---|
Total Population | 9,374 | 61,027 | 179,980 | |
Population Median Age | 36 | 39 | 37 | |
Population by Age | 0-9 Yrs | 1182 (12%) | 7414 (12%) | 24054 (13%) |
10-19 Yrs | 1538 (16%) | 8440 (13%) | 25447 (14%) | |
20-29 Yrs | 1950 (20%) | 8865 (14%) | 29417 (16%) | |
30-39 Yrs | 1001 (10%) | 7561 (12%) | 25106 (13%) | |
40-49 Yrs | 880 (9%) | 7361 (12%) | 20521 (11%) | |
50-59 Yrs | 1027 (10%) | 7346 (12%) | 21116 (11%) | |
60-69 Yrs | 643 (6%) | 6006 (9%) | 16976 (9%) | |
70+ Yrs | 1153 (12%) | 8035 (13%) | 17343 (9%) | |
Median HH Income | $42,877 | $68,656 | $62,279 | |
Total Household Income | < 24K | 1104 (31%) | 4225 (17%) | 12868 (19%) |
25-49K | 891 (25%) | 4985 (20%) | 14643 (21%) | |
50-74K | 517 (14%) | 3785 (15%) | 11568 (17%) | |
75-99K | 396 (11%) | 2791 (11%) | 8352 (12%) | |
100-199K | 417 (11%) | 5560 (22%) | 14012 (20%) | |
200K+ | 183 (5%) | 2856 (11%) | 5822 (8%) | |
Highest Education Level | No Diploma | 740 | 2237 | 10442 |
Diploma or GED | 959 | 6161 | 21006 | |
Some College | 841 | 6879 | 21775 | |
Assoc. Degree | 312 | 2610 | 8696 | |
Bachelors Degree | 1279 | 12846 | 33763 | |
Higher Degree | 1040 | 9315 | 20626 | |
Total Housing Units | 3,626 | 25,102 | 70,625 | |
--Owner-Occupied | 1,205 | 15,211 | 42,454 | |
--Renter-Occupied | 2,303 | 8,992 | 24,811 | |
Owner-Occupied Values | < 100K | 95 | 1015 | 5824 |
100-199K | 350 | 4163 | 16214 | |
200-299K | 373 | 3998 | 9179 | |
300-399K | 269 | 2819 | 4837 | |
400-499K | 81 | 1514 | 2771 | |
500K+ | 36 | 1701 | 3630 | |
Total Working Age Population | 7,677 | 49,078 | 141,409 | |
In Work Force | 4,681 | 31,909 | 95,521 | |
Not In Work Force | 2,996 | 17,168 | 45,889 | |
Workforce Employed | 4,246 | 30,559 | 90,671 | |
Workforce Unemployed | 427 | 1,289 | 4,787 | |
Civlian Workforce | 4,673 | 31,848 | 95,459 | |
Military Workforce | 8 | 62 | 62 | |
Total Households | 3,509 | 24,202 | 67,264 | |
Family Households | 1,906 | 14,868 | 41,993 | |
Non-Family Households | 1,603 | 9,334 | 25,271 | |
Married Couple | 1,125 | 11,708 | 30,883 | |
Other Family | 780 | 3,161 | 11,110 | |
Married w/Child | 436 | 5,106 | 13,827 | |
Single Male w/Child | 85 | 400 | 1,483 | |
Single Female w/Child | 336 | 1,278 | 4,575 |
Population Change Last Two Decades - Plus Projection
2000 | % | 2010 | % | 2020 | % | 2030 | |
---|---|---|---|---|---|---|---|
Michigan | 9,938,444 | -1 | 9,883,640 | +1 | 10,023,423 | +4 | 10,424,510 |
Kent County | 574,335 | +5 | 602,622 | +11 | 668,535 | +12 | 746,921 |
Total Working Age Population:
Total Households:
Total Working Age Population:
Total Households:
Total Working Age Population:
Total Households: