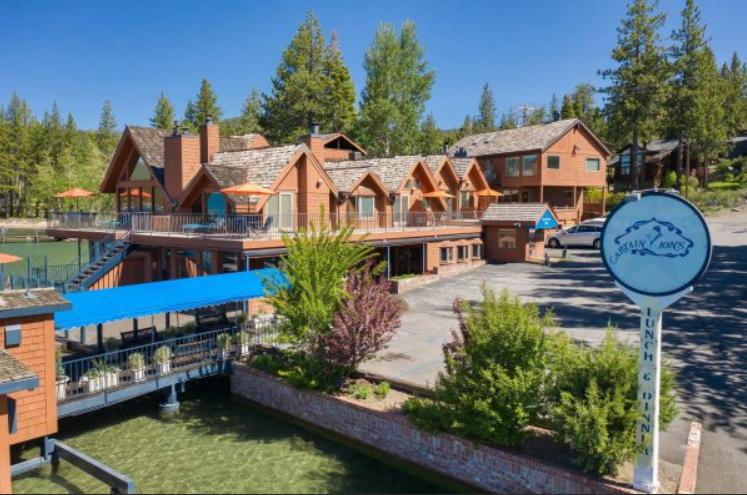
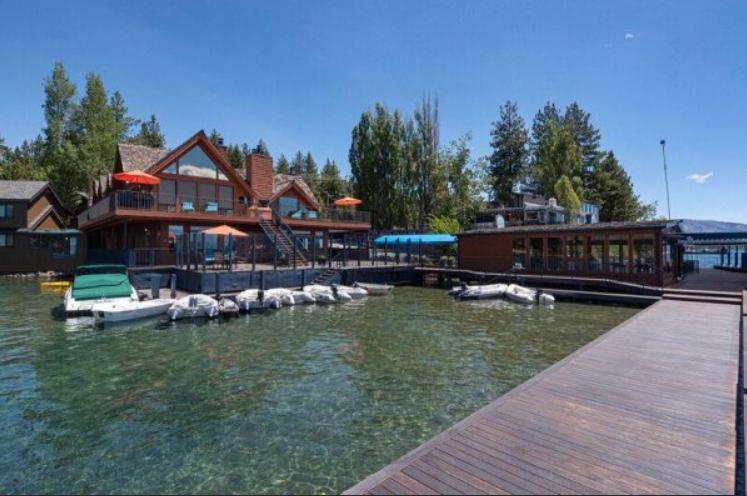
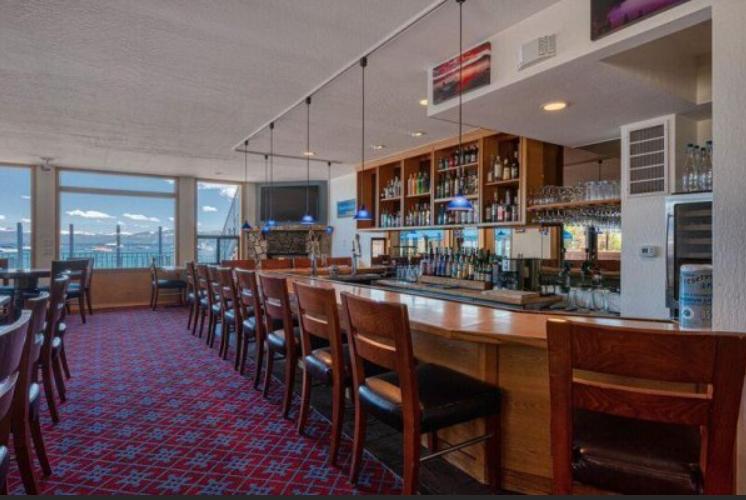
This iconic Lake Tahoe property, known as Captain Jon's, presents a unique opportunity for new ownership. Possible uses include a private club, joint ownership to share the use of six 2-bedrooms, 2-bath apartments, or the revival of the restaurant and boathouse bar by a notable operator. A combination of all three of these concepts is also possible. This is a great compound for a couple of families or an opportunity to be retained as a unique and scarce waterfront lifestyle restaurant and the marina next to the Ritz Carlton and Martis Camp Lake Clubs. Originally built in 1909, it was the casino and dance hall of the Tahoe Vista Hotel. Its large dock was one of three stops for the celebrated Tahoe Steamer. In the early 1970s, it was converted into a restaurant, operating marina and guest suites. Completely remodeled in the 1980s, this boutique resort now contains the six suites, spacious iron breakwater dock to accommodate food service, a 30-mooring marina, and fully-equipped restaurant and boathouse bar. All components have governmental entitlements for existing uses. The property is 15 miles from Truckee, California, about 50 minutes from Reno, Nevada and 20 minutes from private plane Truckee Tahoe Airport. Shopping, dining, services, gaming, and entertainment are within 10-to-40 minutes away. The property is ideally located on the North Shore between the two main routes from Tahoe to I-80 (artery to San Francisco and Reno). It is situated in an area that has an upscale residential component as well as resort commercial elements. Grocery is located one mile away, casinos five miles away, and many restaurants and shops are close by. Skiing Most skiing facilities are within 30 minutes and include: -Squaw Valley - 25 Minutes -Alpine Meadows - 25 Minutes -Northstar - 15 Minutes -Incline - 20 Minutes -Homewood - 25 Minutes Travel Flying: -Reno International Airport - 55 Minutes -South Lake Tahoe Airport - 40 Minutes -Truckee Airport - 30 Mintues