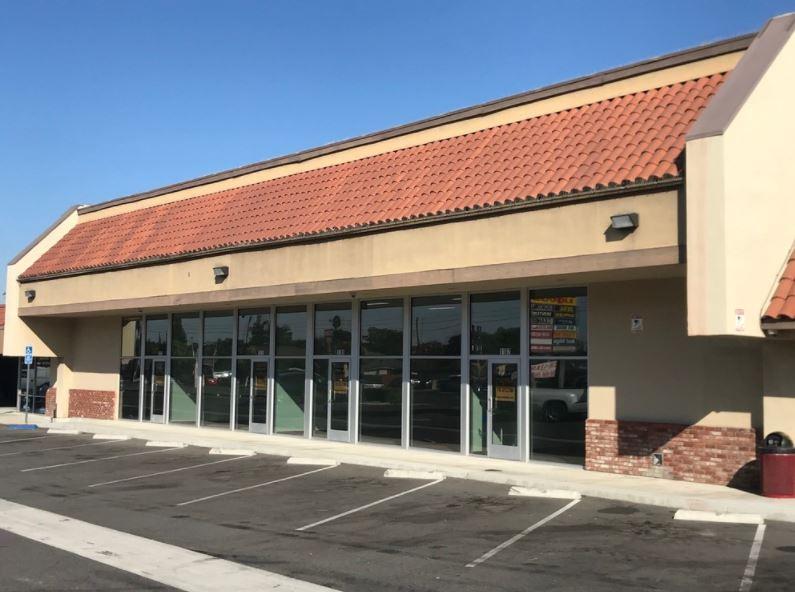
Retail Space
1043 West Orangethorpe Avenue Fullerton, CA 92833
1043 West Orangethorpe Avenue Fullerton, CA 92833
Details & Description
Property Highlights
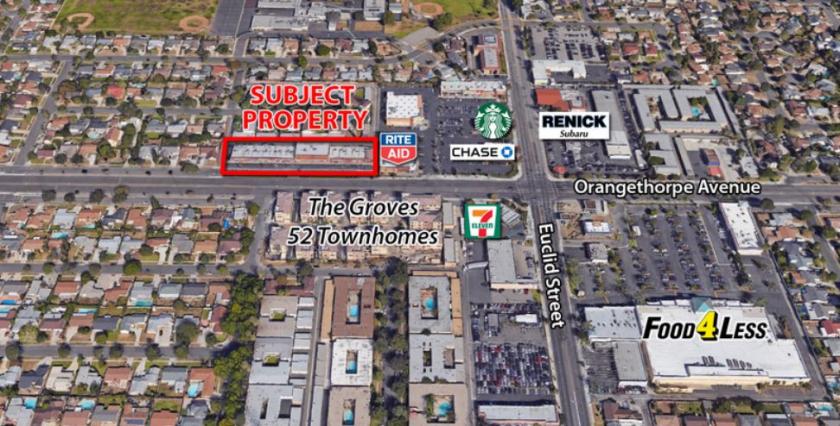
• Positioned within a high-density residential area with average income of $84,539 within 3-mile radius
• Benefits from 23,745 cars per day on Orangethorpe Avenue 42,329 on Euclid Street
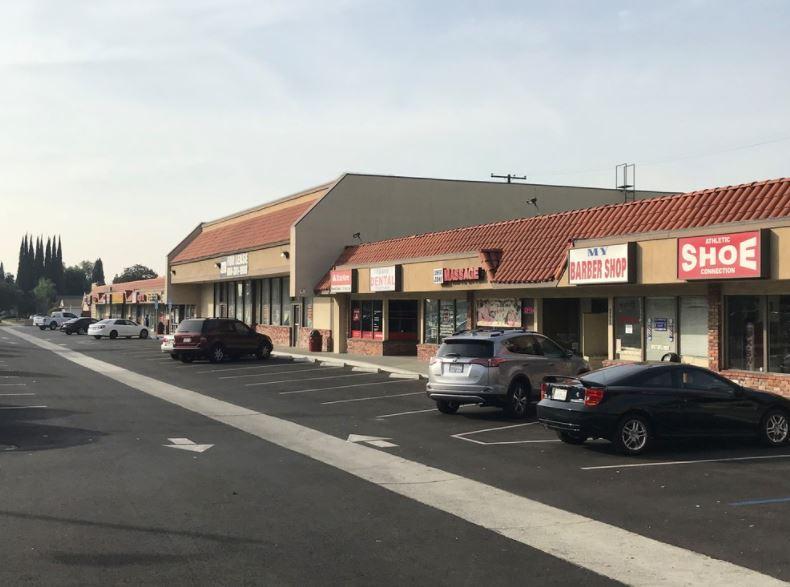
Additional Photos
Listing Agents

Tim Muller
O: 714-210-6724
tmuller@coreland.com
O: 714-210-6724
tmuller@coreland.com
While we strive to provide the most accurate information, all listing information, and demographic data, is provided by third-parties. As such, MyEListing will not be responsible for the accuracy of the information. It is strongly recommended that you verify all information with the listing agent, and any relevant agencies, prior to making any decisions.


