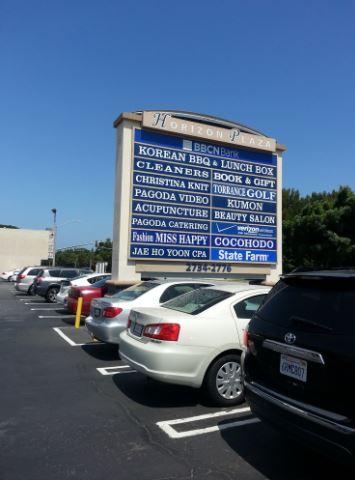
Retail Space
2734 Sepulveda Boulevard Torrance, CA 90505
2734 Sepulveda Boulevard Torrance, CA 90505
Details & Description
Property Highlights
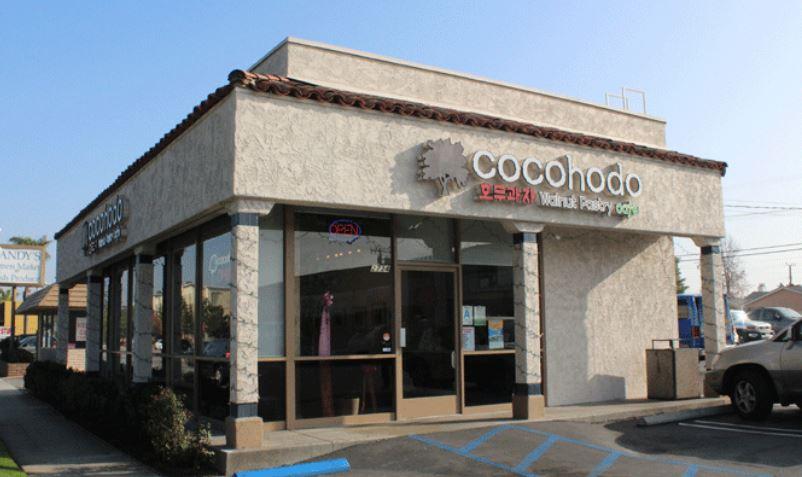
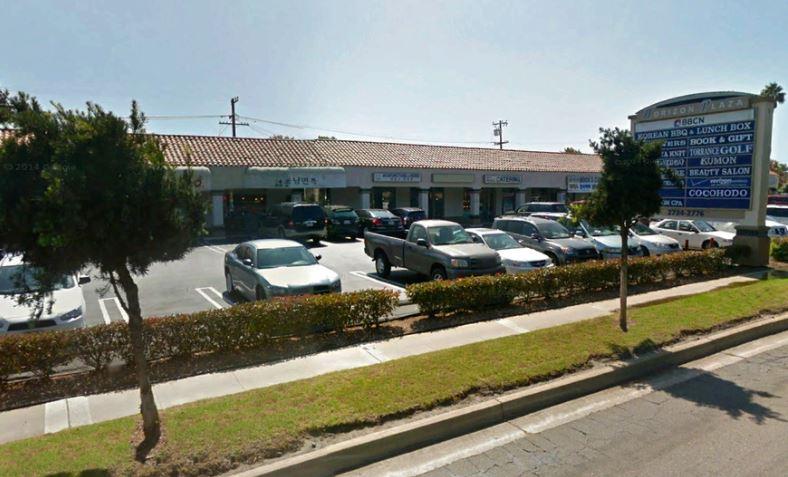
• Great synergy among many longstanding co-tenants, including local favorite, Korean walnut pastry cafe Cocohodo
• Surrounded by densely-populated Torrance housing community and within close proximity to Shery High School
Listing Agents

Chris Premac
O: 714-573-7780
M: 714-210-6705
cpremac@coreland.com
O: 714-573-7780
M: 714-210-6705
cpremac@coreland.com
While we strive to provide the most accurate information, all listing information, and demographic data, is provided by third-parties. As such, MyEListing will not be responsible for the accuracy of the information. It is strongly recommended that you verify all information with the listing agent, and any relevant agencies, prior to making any decisions.