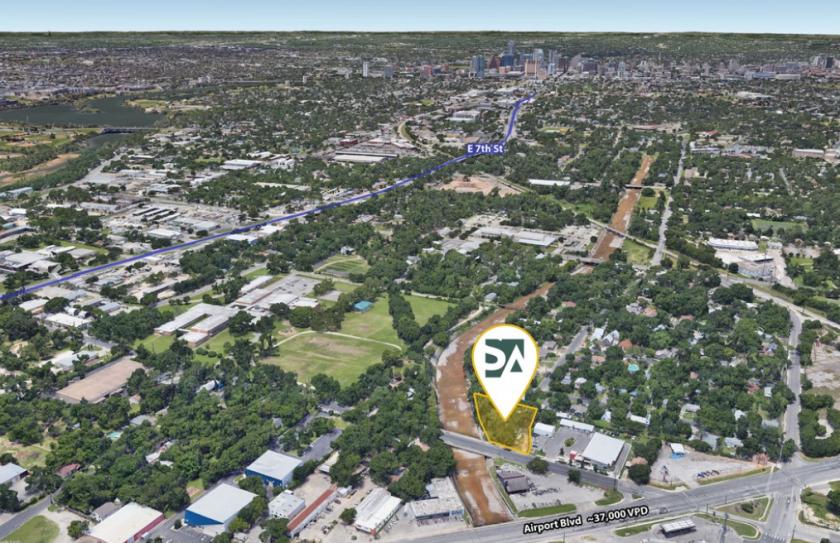
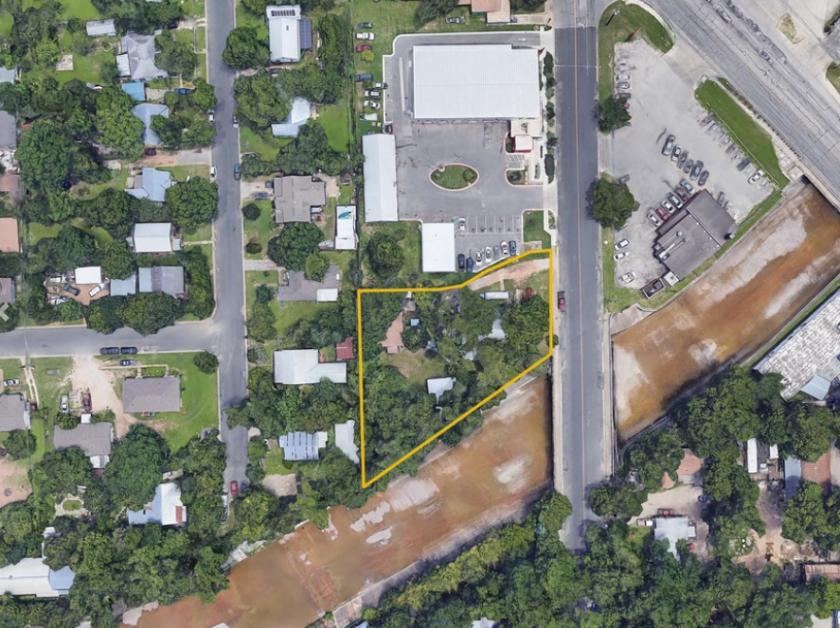
Commercial Land
920 Shady Lane Austin, TX 78702
920 Shady Lane Austin, TX 78702
Details & Description
Property Highlights
• Zoning allows for a variety of commercial uses office, retail, restaurant, food prep, etc..
• Close proximity to the E 6th and E 7th St entertainment districts
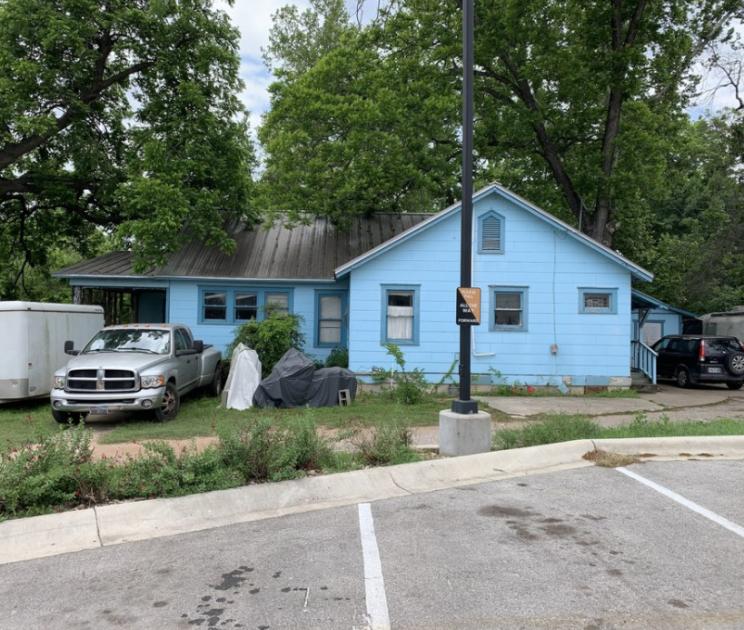
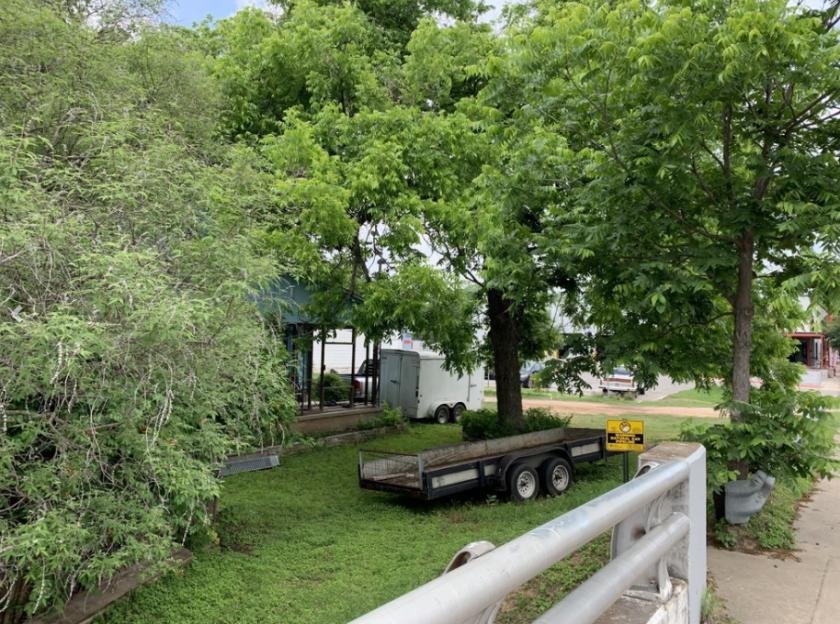
Additional Photos

Listing Agents

Jake Malone
O: 512-897-3075
jake@sayersadvisors.com
O: 512-897-3075
jake@sayersadvisors.com
While we strive to provide the most accurate information, all listing information, and demographic data, is provided by third-parties. As such, MyEListing will not be responsible for the accuracy of the information. It is strongly recommended that you verify all information with the listing agent, and any relevant agencies, prior to making any decisions.


