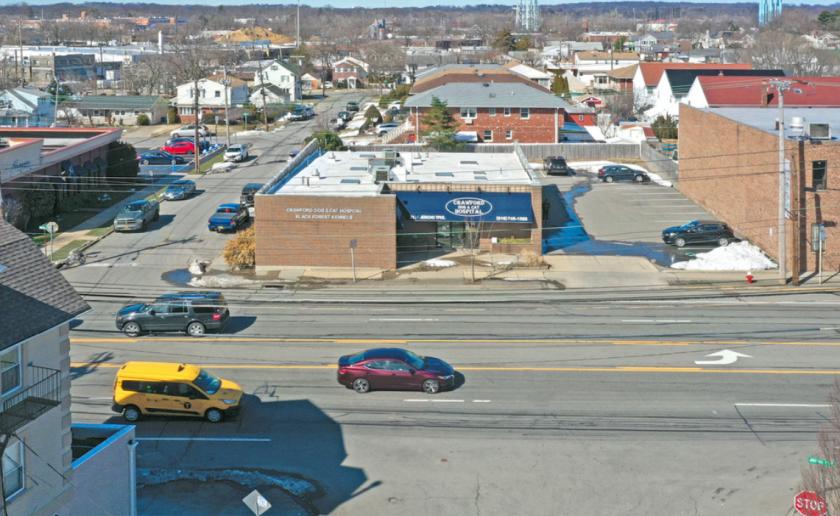
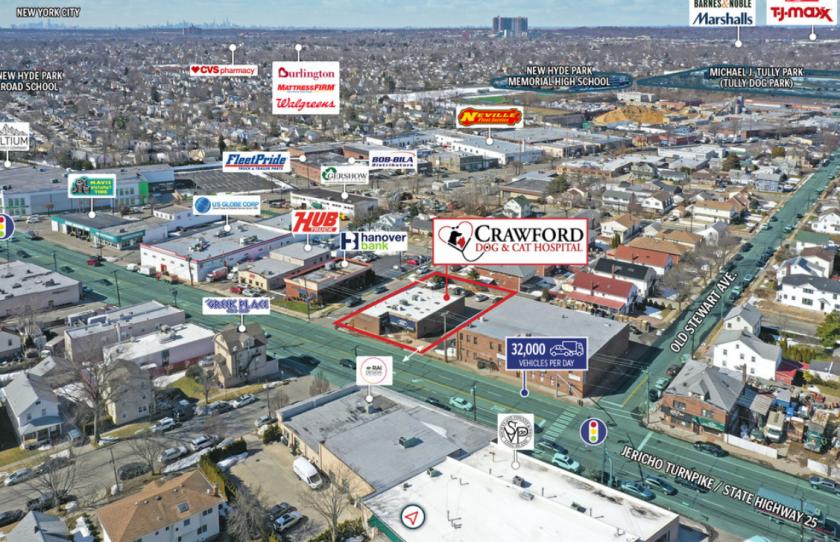
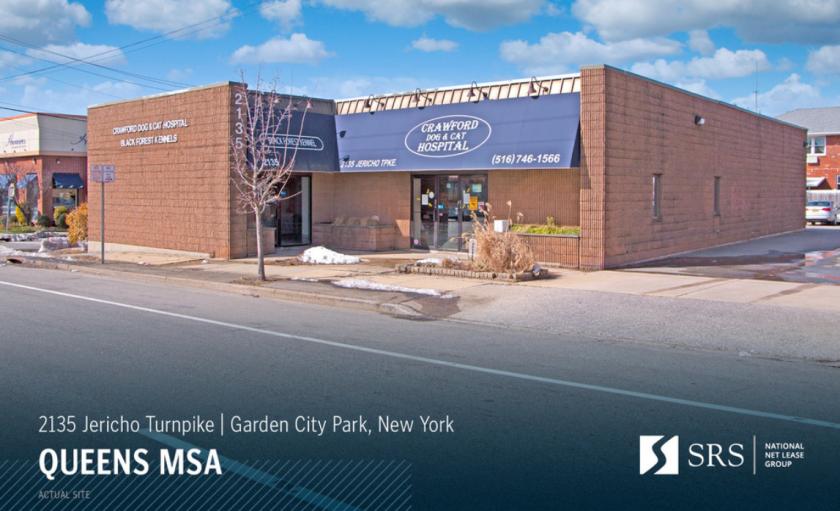
1-Mile | 3-Miles | 5-Miles | ||
---|---|---|---|---|
Total Population | 24,140 | 228,220 | 628,495 | |
Population Median Age | 42 | 42 | 41 | |
Population by Age | 0-9 Yrs | 2655 (10%) | 25390 (11%) | 70365 (11%) |
10-19 Yrs | 3079 (12%) | 26768 (11%) | 76267 (12%) | |
20-29 Yrs | 2443 (10%) | 28051 (12%) | 79981 (12%) | |
30-39 Yrs | 2608 (10%) | 25311 (11%) | 73343 (11%) | |
40-49 Yrs | 3418 (14%) | 29716 (13%) | 82290 (13%) | |
50-59 Yrs | 3426 (14%) | 33862 (14%) | 92350 (14%) | |
60-69 Yrs | 3037 (12%) | 28492 (12%) | 76862 (12%) | |
70+ Yrs | 3472 (14%) | 30631 (13%) | 77038 (12%) | |
Median HH Income | $134,667 | $113,235 | $104,367 | |
Total Household Income | < 24K | 581 (7%) | 6635 (8%) | 20315 (10%) |
25-49K | 779 (10%) | 8474 (11%) | 26251 (13%) | |
50-74K | 554 (7%) | 8909 (11%) | 25776 (12%) | |
75-99K | 903 (11%) | 9410 (12%) | 24332 (12%) | |
100-199K | 2599 (34%) | 25951 (34%) | 66861 (33%) | |
200K+ | 2221 (29%) | 16352 (21%) | 37667 (18%) | |
Highest Education Level | No Diploma | 1121 | 14830 | 48966 |
Diploma or GED | 3664 | 36173 | 103127 | |
Some College | 2453 | 23275 | 68267 | |
Assoc. Degree | 1142 | 11866 | 35144 | |
Bachelors Degree | 4816 | 41958 | 104211 | |
Higher Degree | 3981 | 34104 | 81738 | |
Total Housing Units | 7,758 | 79,177 | 212,234 | |
--Owner-Occupied | 6,787 | 60,523 | 153,798 | |
--Renter-Occupied | 850 | 15,208 | 47,403 | |
Owner-Occupied Values | < 100K | 139 | 1115 | 3159 |
100-199K | 52 | 1330 | 5187 | |
200-299K | 56 | 2843 | 12408 | |
300-399K | 309 | 5844 | 23697 | |
400-499K | 870 | 9655 | 29108 | |
500K+ | 5359 | 39735 | 80238 | |
Total Working Age Population | 19,557 | 187,759 | 513,660 | |
In Work Force | 12,151 | 118,361 | 328,901 | |
Not In Work Force | 7,406 | 69,398 | 184,759 | |
Workforce Employed | 11,759 | 113,903 | 313,558 | |
Workforce Unemployed | 388 | 4,386 | 15,169 | |
Civlian Workforce | 12,148 | 118,290 | 328,728 | |
Military Workforce | 3 | 71 | 173 | |
Total Households | 7,637 | 75,731 | 201,201 | |
Family Households | 6,497 | 57,513 | 153,265 | |
Non-Family Households | 1,140 | 18,217 | 47,936 | |
Married Couple | 5,635 | 47,172 | 115,965 | |
Other Family | 863 | 10,342 | 37,300 | |
Married w/Child | 2,400 | 19,956 | 48,237 | |
Single Male w/Child | 61 | 597 | 2,938 | |
Single Female w/Child | 104 | 2,564 | 9,206 |
Population Change Last Two Decades - Plus Projection
2000 | % | 2010 | % | 2020 | % | 2030 | |
---|---|---|---|---|---|---|---|
New York | 18,976,457 | +2 | 19,378,102 | +4 | 20,146,131 | +2 | 20,604,030 |
Nassau County | 1,334,544 | 0 | 1,339,532 | +4 | 1,386,500 | +3 | 1,432,859 |
Queens County | 2,229,379 | 0 | 2,230,722 | +9 | 2,436,549 | +5 | 2,565,268 |
Total Working Age Population:
Total Households:
Total Working Age Population:
Total Households:
Total Working Age Population:
Total Households: