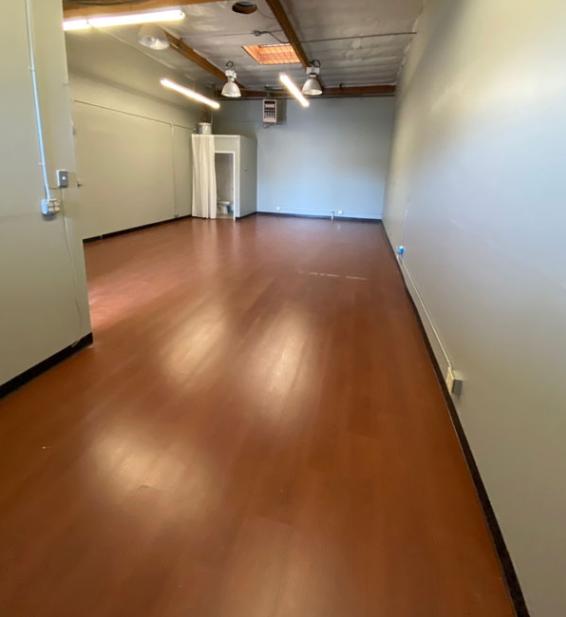
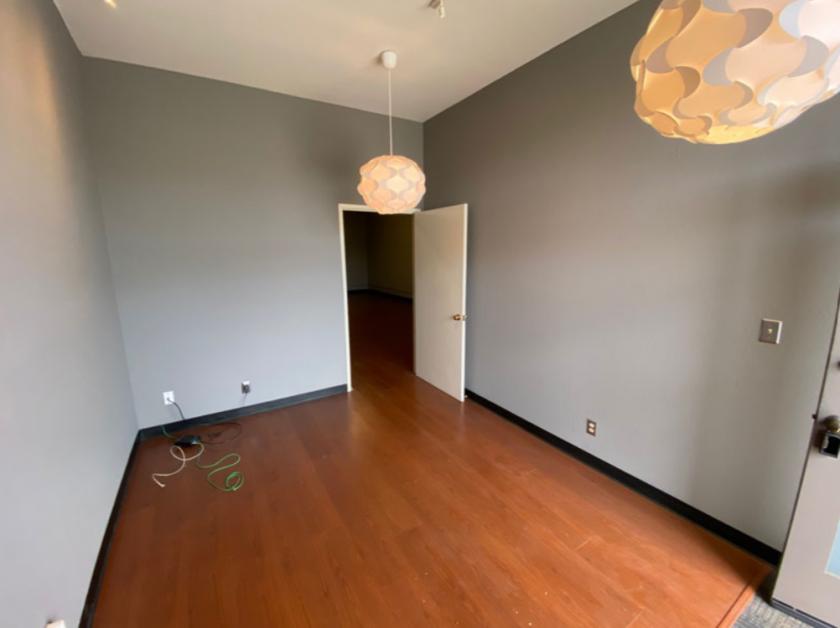
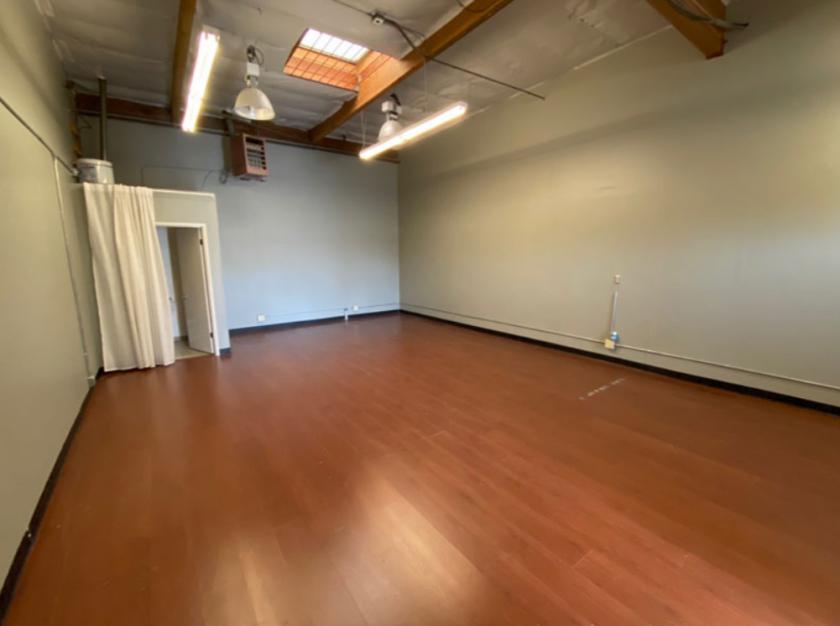
1-Mile | 3-Miles | 5-Miles | ||
---|---|---|---|---|
Total Population | 21,103 | 128,519 | 305,880 | |
Population Median Age | 38 | 38 | 37 | |
Population by Age | 0-9 Yrs | 2675 (12%) | 15491 (12%) | 37009 (12%) |
10-19 Yrs | 1989 (9%) | 14552 (11%) | 37777 (12%) | |
20-29 Yrs | 3116 (14%) | 18368 (14%) | 50387 (16%) | |
30-39 Yrs | 3959 (18%) | 21442 (16%) | 48785 (15%) | |
40-49 Yrs | 2874 (13%) | 18603 (14%) | 41965 (13%) | |
50-59 Yrs | 2391 (11%) | 15819 (12%) | 35055 (11%) | |
60-69 Yrs | 1811 (8%) | 11326 (8%) | 26392 (8%) | |
70+ Yrs | 2288 (10%) | 12918 (10%) | 28510 (9%) | |
Median HH Income | $138,529 | $149,498 | $145,220 | |
Total Household Income | < 24K | 993 (11%) | 4882 (9%) | 10619 (9%) |
25-49K | 751 (9%) | 4409 (8%) | 10573 (9%) | |
50-74K | 619 (7%) | 4164 (8%) | 10197 (9%) | |
75-99K | 674 (8%) | 4112 (8%) | 8824 (7%) | |
100-199K | 2479 (29%) | 14696 (28%) | 31615 (28%) | |
200K+ | 2780 (33%) | 18795 (36%) | 40045 (35%) | |
Highest Education Level | No Diploma | 1323 | 4924 | 16421 |
Diploma or GED | 1267 | 6270 | 17458 | |
Some College | 1453 | 8104 | 20159 | |
Assoc. Degree | 652 | 3865 | 9210 | |
Bachelors Degree | 4251 | 27194 | 59945 | |
Higher Degree | 6225 | 41514 | 87196 | |
Total Housing Units | 8,774 | 54,241 | 119,180 | |
--Owner-Occupied | 4,027 | 25,015 | 55,338 | |
--Renter-Occupied | 4,270 | 26,044 | 56,535 | |
Owner-Occupied Values | < 100K | 33 | 421 | 978 |
100-199K | 122 | 554 | 1326 | |
200-299K | 18 | 270 | 784 | |
300-399K | 6 | 324 | 799 | |
400-499K | 37 | 178 | 547 | |
500K+ | 3811 | 23267 | 50904 | |
Total Working Age Population | 17,054 | 103,135 | 246,894 | |
In Work Force | 12,022 | 71,061 | 166,971 | |
Not In Work Force | 5,031 | 32,074 | 79,923 | |
Workforce Employed | 11,777 | 68,735 | 161,063 | |
Workforce Unemployed | 245 | 2,180 | 5,689 | |
Civlian Workforce | 12,022 | 70,915 | 166,752 | |
Military Workforce | 0 | 146 | 219 | |
Total Households | 8,296 | 51,058 | 111,873 | |
Family Households | 5,009 | 32,000 | 71,762 | |
Non-Family Households | 3,288 | 19,058 | 40,111 | |
Married Couple | 3,949 | 26,003 | 59,183 | |
Other Family | 1,060 | 5,997 | 12,579 | |
Married w/Child | 1,772 | 12,313 | 28,458 | |
Single Male w/Child | 177 | 788 | 1,601 | |
Single Female w/Child | 312 | 2,081 | 4,169 |
Population Change Last Two Decades - Plus Projection
2000 | % | 2010 | % | 2020 | % | 2030 | |
---|---|---|---|---|---|---|---|
California | 33,871,648 | +10 | 37,253,956 | +9 | 40,467,295 | +8 | 43,631,295 |
Alameda County | 1,443,741 | +5 | 1,510,271 | +12 | 1,696,752 | +10 | 1,861,027 |
San Mateo County | 707,161 | +2 | 718,451 | +9 | 785,650 | +6 | 833,868 |
Santa Clara County | 1,682,585 | +6 | 1,781,642 | +12 | 1,996,394 | +10 | 2,194,079 |
Total Working Age Population:
Total Households:
Total Working Age Population:
Total Households:
Total Working Age Population:
Total Households: