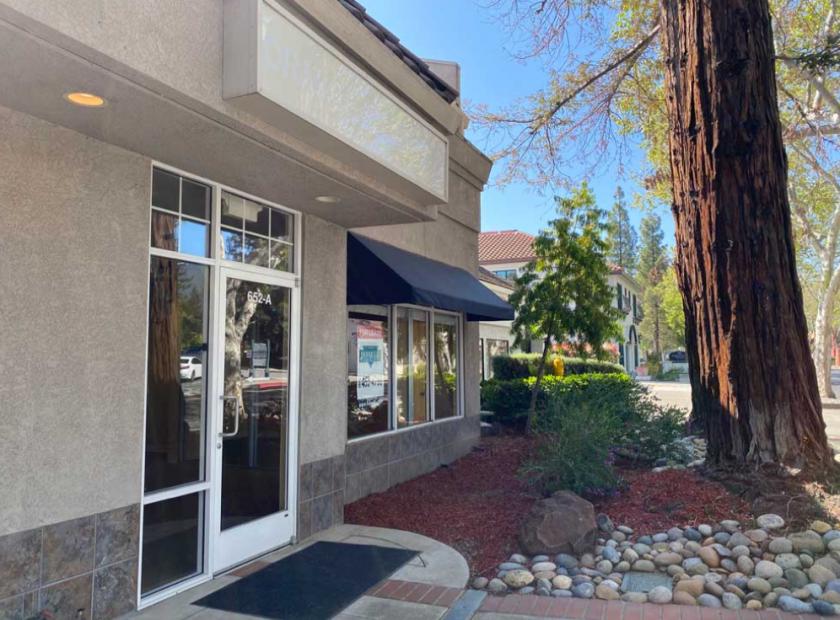
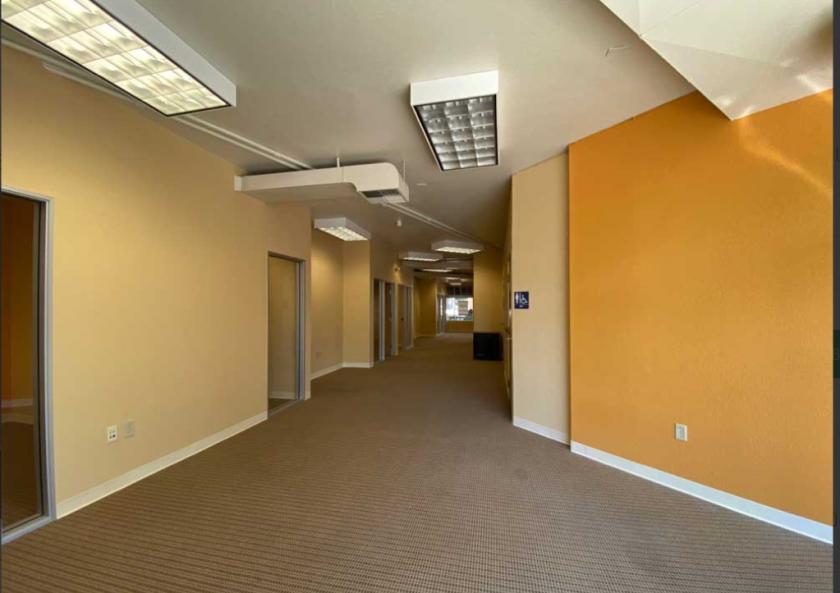
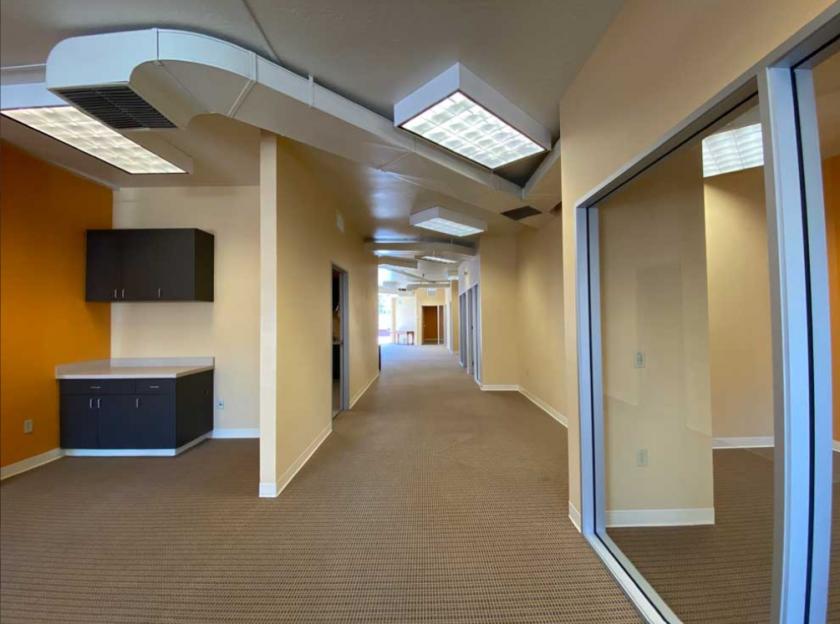
1-Mile | 3-Miles | 5-Miles | ||
---|---|---|---|---|
Total Population | 11,525 | 73,368 | 235,799 | |
Population Median Age | 42 | 42 | 40 | |
Population by Age | 0-9 Yrs | 1108 (9%) | 8472 (11%) | 29270 (12%) |
10-19 Yrs | 1806 (15%) | 10099 (13%) | 29918 (12%) | |
20-29 Yrs | 764 (6%) | 5281 (7%) | 21428 (9%) | |
30-39 Yrs | 1150 (9%) | 7789 (10%) | 30905 (13%) | |
40-49 Yrs | 1776 (15%) | 11275 (15%) | 35312 (14%) | |
50-59 Yrs | 2143 (18%) | 12565 (17%) | 36805 (15%) | |
60-69 Yrs | 1357 (11%) | 8456 (11%) | 26249 (11%) | |
70+ Yrs | 1421 (12%) | 9432 (12%) | 25911 (10%) | |
Median HH Income | $173,467 | $170,891 | $146,346 | |
Total Household Income | < 24K | 276 (5%) | 1940 (7%) | 6998 (8%) |
25-49K | 345 (7%) | 2201 (8%) | 8313 (9%) | |
50-74K | 366 (7%) | 1761 (6%) | 7242 (8%) | |
75-99K | 423 (9%) | 2196 (8%) | 7941 (9%) | |
100-199K | 1216 (26%) | 7440 (27%) | 24338 (28%) | |
200K+ | 2034 (43%) | 11298 (42%) | 29517 (34%) | |
Highest Education Level | No Diploma | 196 | 1853 | 8340 |
Diploma or GED | 647 | 4863 | 20442 | |
Some College | 1042 | 7219 | 25787 | |
Assoc. Degree | 318 | 3118 | 10450 | |
Bachelors Degree | 3286 | 18598 | 55007 | |
Higher Degree | 2860 | 16693 | 47173 | |
Total Housing Units | 5,022 | 28,745 | 89,367 | |
--Owner-Occupied | 2,767 | 18,661 | 55,773 | |
--Renter-Occupied | 1,892 | 8,176 | 28,576 | |
Owner-Occupied Values | < 100K | 6 | 263 | 668 |
100-199K | 0 | 173 | 445 | |
200-299K | 4 | 92 | 275 | |
300-399K | 3 | 48 | 428 | |
400-499K | 2 | 161 | 774 | |
500K+ | 2753 | 17923 | 53184 | |
Total Working Age Population | 9,164 | 58,006 | 187,070 | |
In Work Force | 5,959 | 36,428 | 122,282 | |
Not In Work Force | 3,205 | 21,578 | 64,788 | |
Workforce Employed | 5,684 | 35,072 | 118,146 | |
Workforce Unemployed | 275 | 1,347 | 4,113 | |
Civlian Workforce | 5,959 | 36,419 | 122,259 | |
Military Workforce | 0 | 9 | 23 | |
Total Households | 4,660 | 26,836 | 84,349 | |
Family Households | 3,091 | 20,089 | 62,614 | |
Non-Family Households | 1,568 | 6,747 | 21,735 | |
Married Couple | 2,660 | 17,078 | 52,106 | |
Other Family | 431 | 3,011 | 10,508 | |
Married w/Child | 1,248 | 7,769 | 24,973 | |
Single Male w/Child | 80 | 412 | 1,410 | |
Single Female w/Child | 110 | 909 | 3,164 |
Population Change Last Two Decades - Plus Projection
2000 | % | 2010 | % | 2020 | % | 2030 | |
---|---|---|---|---|---|---|---|
California | 33,871,648 | +10 | 37,253,956 | +9 | 40,467,295 | +8 | 43,631,295 |
Santa Clara County | 1,682,585 | +6 | 1,781,642 | +12 | 1,996,394 | +10 | 2,194,079 |
Santa Cruz County | 255,602 | +3 | 262,382 | +6 | 278,997 | +6 | 296,728 |
Total Working Age Population:
Total Households:
Total Working Age Population:
Total Households:
Total Working Age Population:
Total Households: