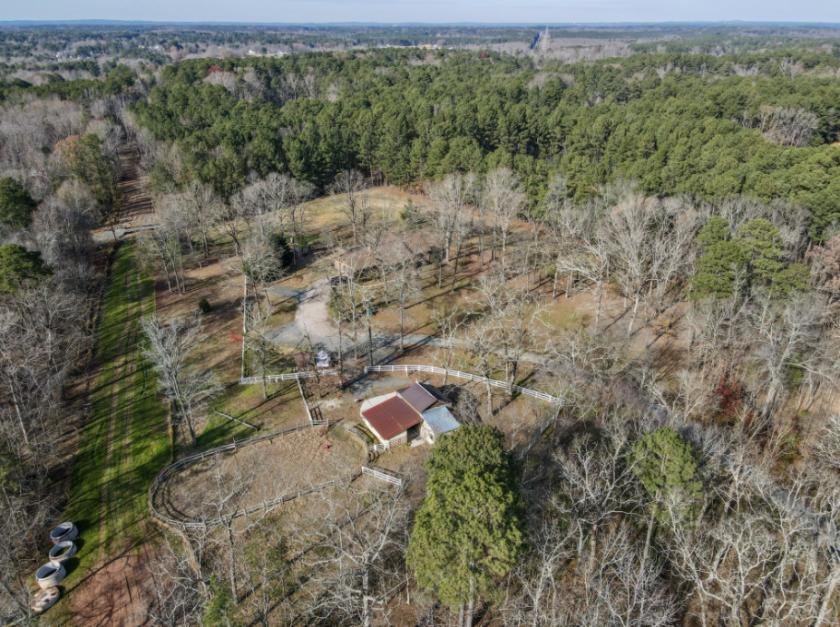
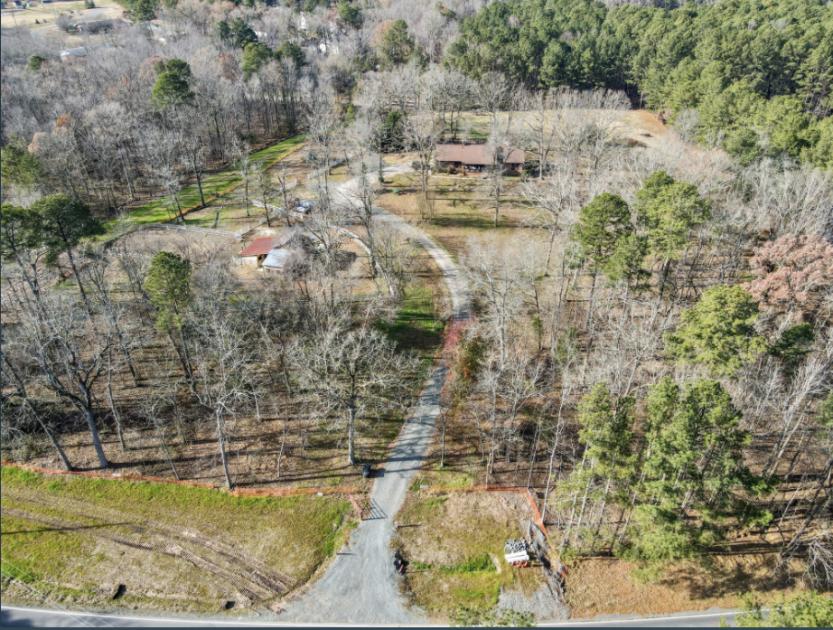
1-Mile | 3-Miles | 5-Miles | ||
---|---|---|---|---|
Total Population | 3,653 | 28,305 | 80,369 | |
Population Median Age | 38 | 36 | 36 | |
Population by Age | 0-9 Yrs | 433 (11%) | 4214 (14%) | 12529 (15%) |
10-19 Yrs | 653 (17%) | 4013 (14%) | 9909 (12%) | |
20-29 Yrs | 277 (7%) | 2773 (9%) | 10226 (12%) | |
30-39 Yrs | 487 (13%) | 4599 (16%) | 13264 (16%) | |
40-49 Yrs | 461 (12%) | 3952 (13%) | 11017 (13%) | |
50-59 Yrs | 649 (17%) | 4049 (14%) | 10703 (13%) | |
60-69 Yrs | 453 (12%) | 2981 (10%) | 7637 (9%) | |
70+ Yrs | 241 (6%) | 1723 (6%) | 5083 (6%) | |
Median HH Income | $95,083 | $82,791 | $68,262 | |
Total Household Income | < 24K | 85 (6%) | 1131 (10%) | 5012 (16%) |
25-49K | 219 (16%) | 2049 (19%) | 6728 (22%) | |
50-74K | 173 (13%) | 1478 (14%) | 4519 (14%) | |
75-99K | 232 (17%) | 1830 (17%) | 4776 (15%) | |
100-199K | 536 (40%) | 3365 (32%) | 7524 (24%) | |
200K+ | 83 (6%) | 604 (5%) | 1887 (6%) | |
Highest Education Level | No Diploma | 181 | 2135 | 7909 |
Diploma or GED | 518 | 4066 | 11184 | |
Some College | 441 | 3398 | 9678 | |
Assoc. Degree | 308 | 1619 | 3982 | |
Bachelors Degree | 695 | 4941 | 13361 | |
Higher Degree | 337 | 2941 | 8029 | |
Total Housing Units | 1,396 | 11,009 | 32,378 | |
--Owner-Occupied | 1,241 | 8,508 | 19,350 | |
--Renter-Occupied | 87 | 1,948 | 11,097 | |
Owner-Occupied Values | < 100K | 63 | 676 | 1781 |
100-199K | 682 | 3715 | 7754 | |
200-299K | 318 | 2350 | 5323 | |
300-399K | 148 | 1191 | 2584 | |
400-499K | 22 | 346 | 967 | |
500K+ | 8 | 230 | 941 | |
Total Working Age Population | 2,908 | 21,753 | 61,602 | |
In Work Force | 2,120 | 16,145 | 44,824 | |
Not In Work Force | 788 | 5,609 | 16,778 | |
Workforce Employed | 1,993 | 15,473 | 42,761 | |
Workforce Unemployed | 127 | 666 | 1,987 | |
Civlian Workforce | 2,120 | 16,140 | 44,747 | |
Military Workforce | 0 | 5 | 76 | |
Total Households | 1,329 | 10,457 | 30,447 | |
Family Households | 1,033 | 7,799 | 20,436 | |
Non-Family Households | 296 | 2,658 | 10,011 | |
Married Couple | 817 | 5,529 | 13,597 | |
Other Family | 216 | 2,270 | 6,838 | |
Married w/Child | 288 | 2,097 | 5,596 | |
Single Male w/Child | 4 | 220 | 899 | |
Single Female w/Child | 67 | 946 | 2,790 |
Population Change Last Two Decades - Plus Projection
2000 | % | 2010 | % | 2020 | % | 2030 | |
---|---|---|---|---|---|---|---|
North Carolina | 8,049,313 | +18 | 9,535,483 | +11 | 10,630,691 | +11 | 11,836,070 |
Durham County | 223,314 | +20 | 267,587 | +20 | 320,322 | +14 | 366,111 |
Granville County | 48,498 | +24 | 59,916 | +4 | 62,147 | +12 | 69,540 |
Wake County | 627,846 | +44 | 900,993 | +23 | 1,109,883 | +20 | 1,328,336 |
Total Working Age Population:
Total Households:
Total Working Age Population:
Total Households:
Total Working Age Population:
Total Households: