Industrial Properties
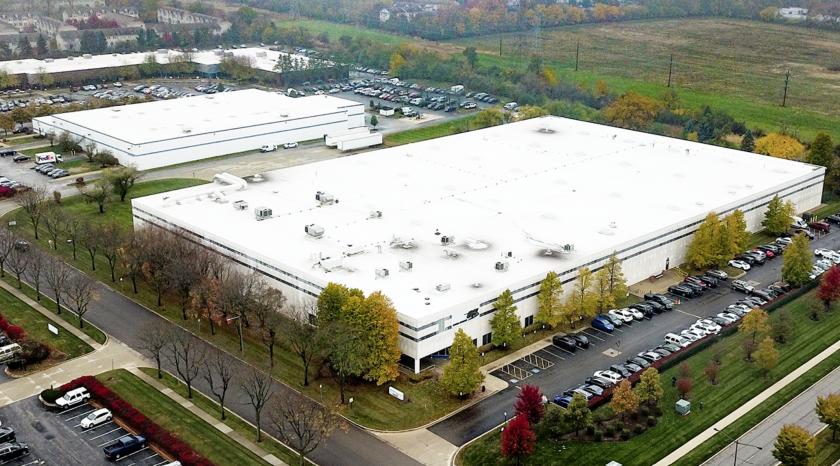
700 North Commerce Street Aurora, IL 60504
700 North Commerce Street Aurora, IL 60504
Details & Description
Property Highlights
- • Strong, skilled area labor pool
- • Ideal corporate headquarters campus environment
- • Established business park environment
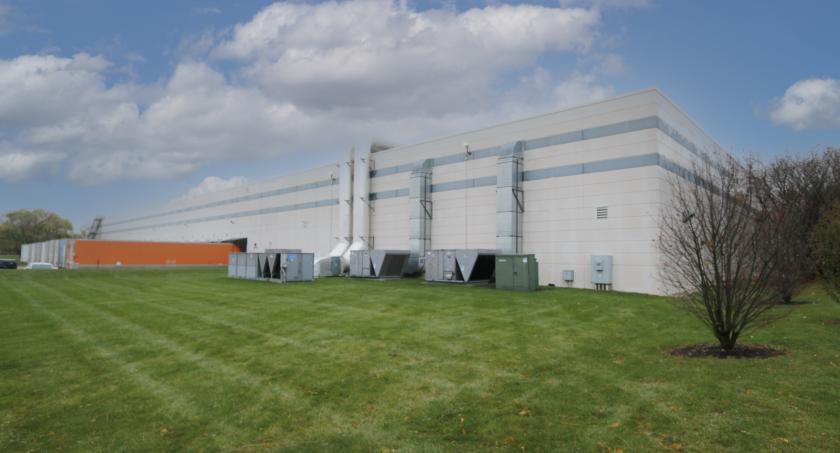
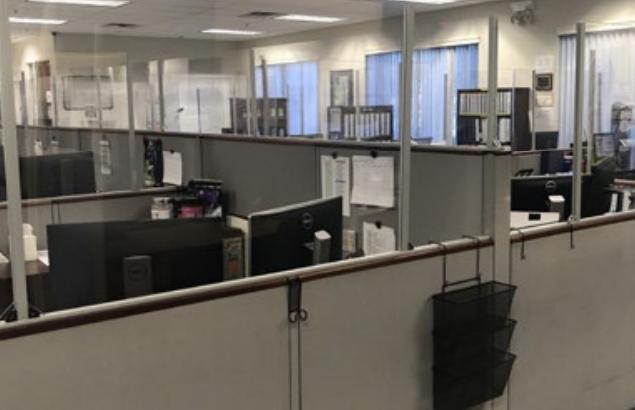
Additional Photos

Listing Agents

Adam Stokes
O: 312-498-7400
M: 312-498-7400
astokes@hiffman.com
O: 312-498-7400
M: 312-498-7400
astokes@hiffman.com

Dan Leahy
O: 630-691-0604
dleahy@hiffman.com
O: 630-691-0604
dleahy@hiffman.com
While we strive to provide the most accurate information, all listing information, and demographic data, is provided by third-parties. As such, MyEListing will not be responsible for the accuracy of the information. It is strongly recommended that you verify all information with the listing agent, and any relevant agencies, prior to making any decisions.


