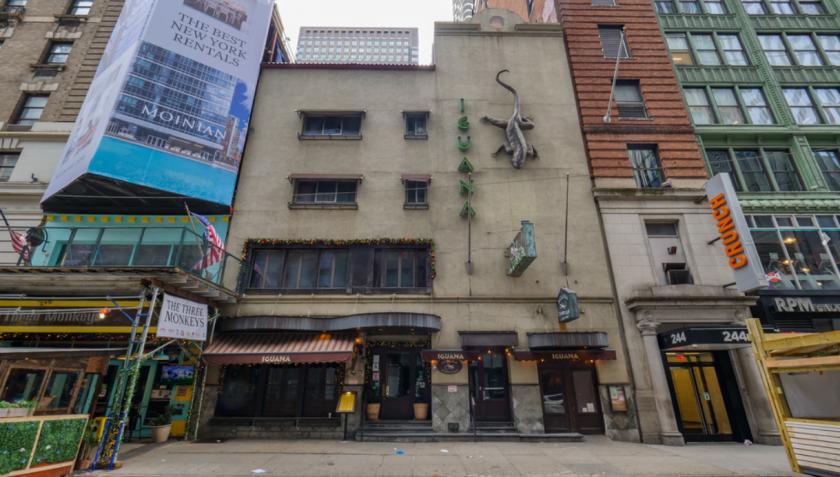
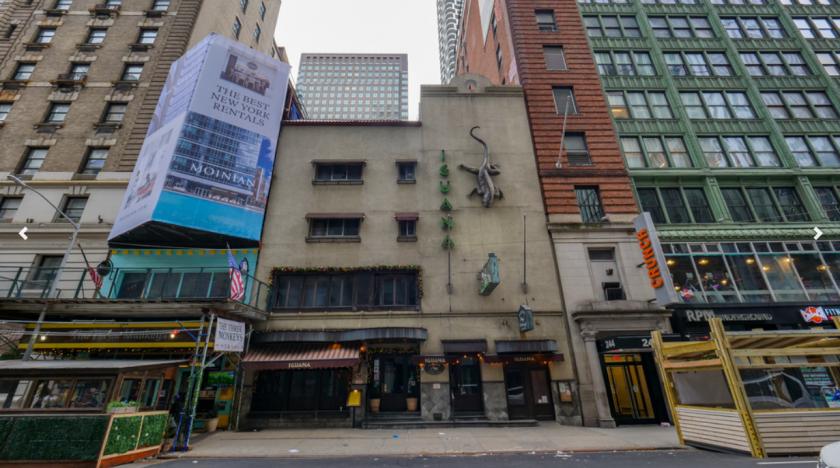
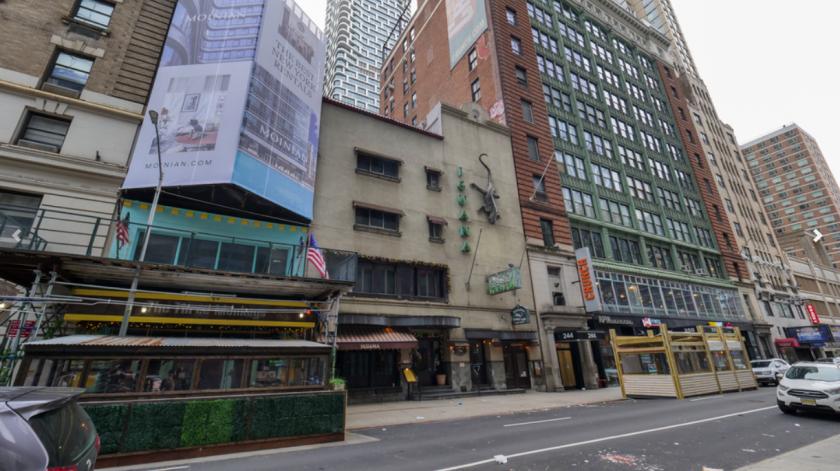
5 to 15 mins walk from: Central Park, Columbus Circle, Times Square, Broadway Theatres, Midtown Central Business District, Rockefeller Center, Fifth Avenue, Grand Central Terminal, Penn Station & the Moynihan Train Hall, Hudson Yards, Hudson River Greenway.1 block away from 7th Ave Station (E, B & D train), 2 blocks from 57th Street Station (N, Q, R & W train), 3 blocks from 50th Street Station (C, E & 1 train), 4 blocks from Columbus Circle Transit Hub.Zoning allows for high-rise construction up to 75,000 SF (as-of-right) or up to 90,000 SF (with additional air rights from the Theater District Bonus Program).B6 Real Estate Advisors has been retained on an exclusive basis to market 238-240 West 54th Street, New York, N.Y. for sale. Located on the southside of 54th Street between Broadway and Eighth Avenue, the property is a 50’ x 100’ lot that is improved by a 28,325 sf (approx.) commercial building that is home to Café Iguana. The property is owner-occupied and will be delivered vacant. Zoned C6-7 in the “Special Midtown District – Theatre Sub-District”, over 75,000 sf. of commercial, mixed-use, hotel or community facility can be developed on the site.238-240 West 54th Street is located in one of the most exciting locations in the world at the intersection of Times Square, Columbus Circle, Midtown, and Midtown West. Of recent, the media has touted the health, environmental and socio-economic benefits of an idealized “15-Minute City,” where everything is readily accessible with limited commuting time. Developing 238-240 West 54th Street into a truly exceptional property would be the embodiment of this ideal allow the new building’s residents and tenants an opportunity to live within arguably the most spectacular “15-Minute City” in the world!