Industrial Properties
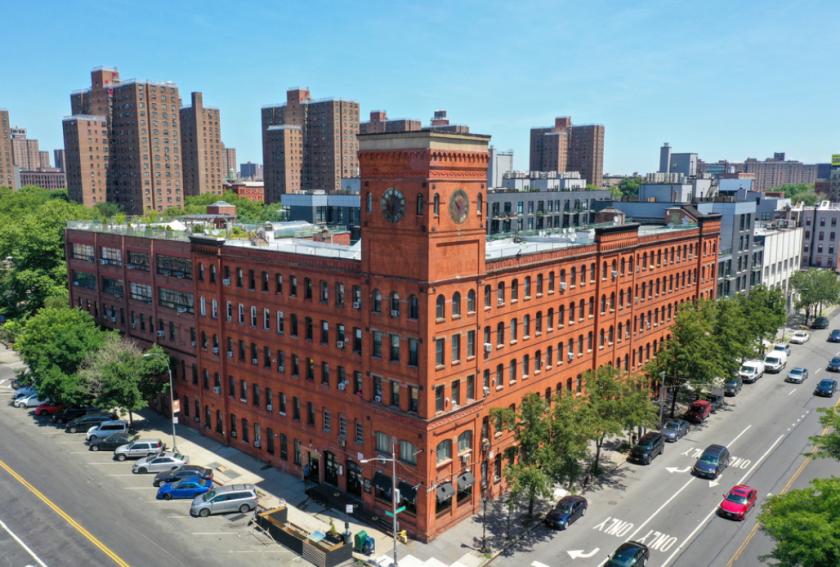
350 Grand Concourse Bronx, NY 10451
350 Grand Concourse Bronx, NY 10451
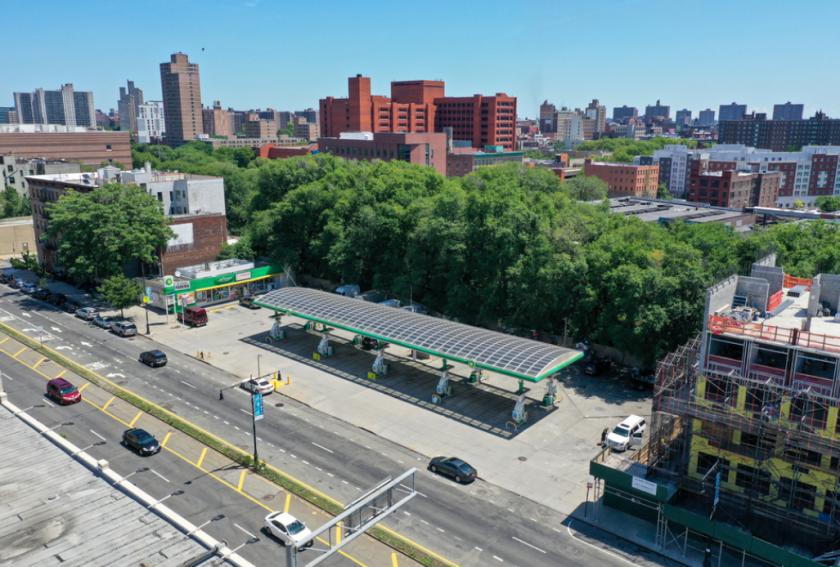
Details & Description
Property Highlights
- • Lower land basis in comparison to Outer Boroughs
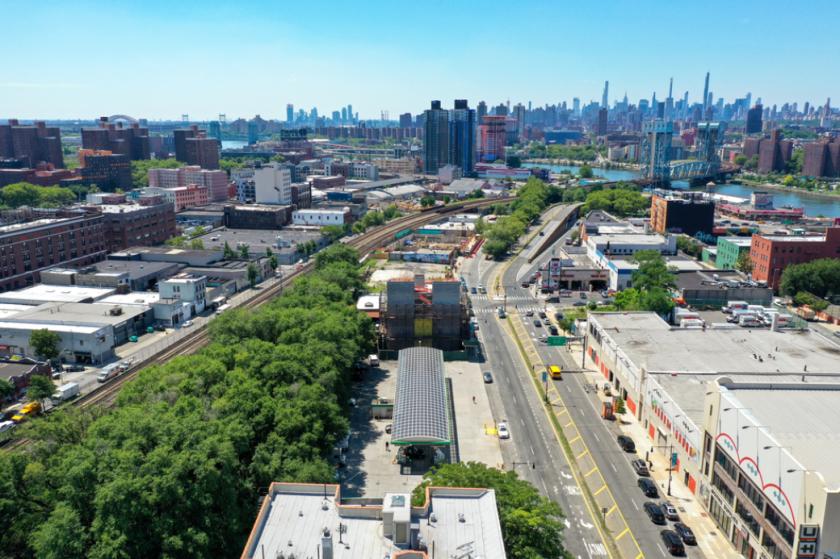
- • 11-minute drive 6.8 miles to La Guardia Airport
- • In a Qualified Opportunity Zone QOZ.
- • Surge of development activity
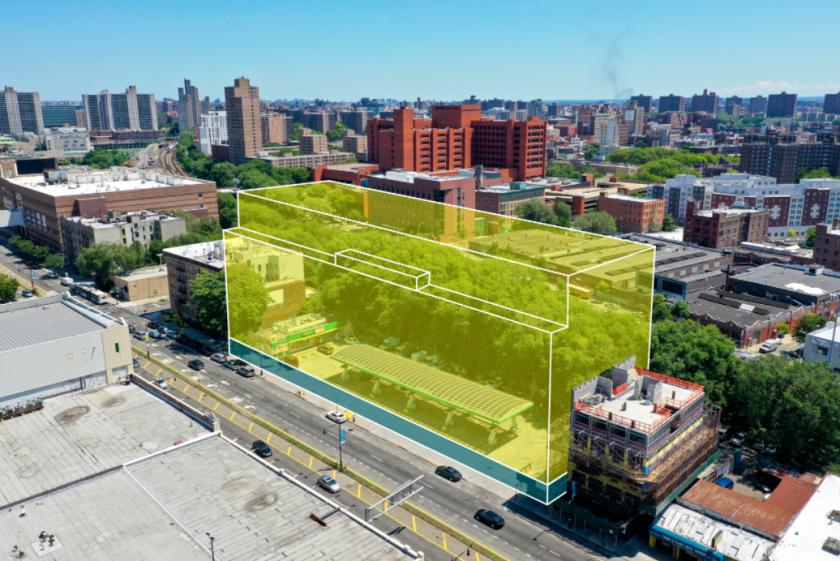
- • Up to 243,323 Buildable Square Feet
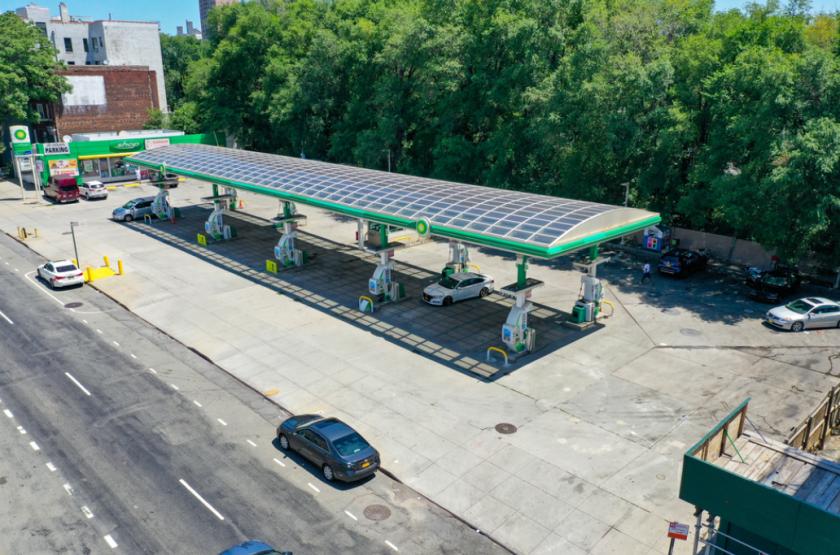
Additional Photos
Listing Agents

Chris Brodhead
O: 646-933-2616
cbrodhead@b6realestate.com
O: 646-933-2616
cbrodhead@b6realestate.com
While we strive to provide the most accurate information, all listing information, and demographic data, is provided by third-parties. As such, MyEListing will not be responsible for the accuracy of the information. It is strongly recommended that you verify all information with the listing agent, and any relevant agencies, prior to making any decisions.


