Industrial Properties
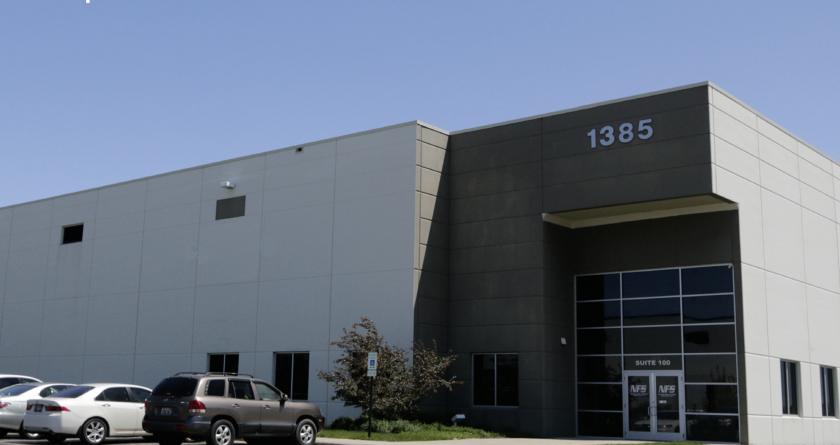
1385 Madeline Lane Elgin, IL 60124
1385 Madeline Lane Elgin, IL 60124
Details & Description
Property Highlights
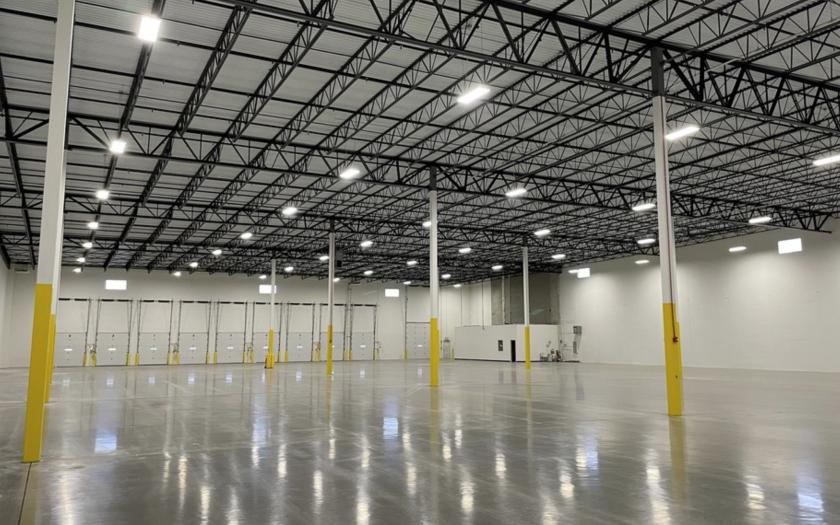
- • Precast Construction
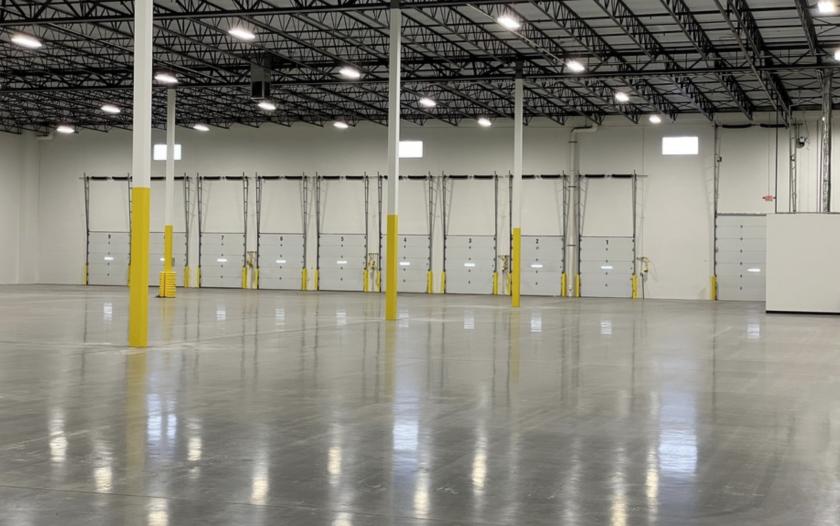
- • 30 Clear Height
- • 9 Exterior Loading Docks
- • 468 x 50 Column Spacing
- • T-5, Energy Efficient Lighting
- • - 35 Car Parking Stalls
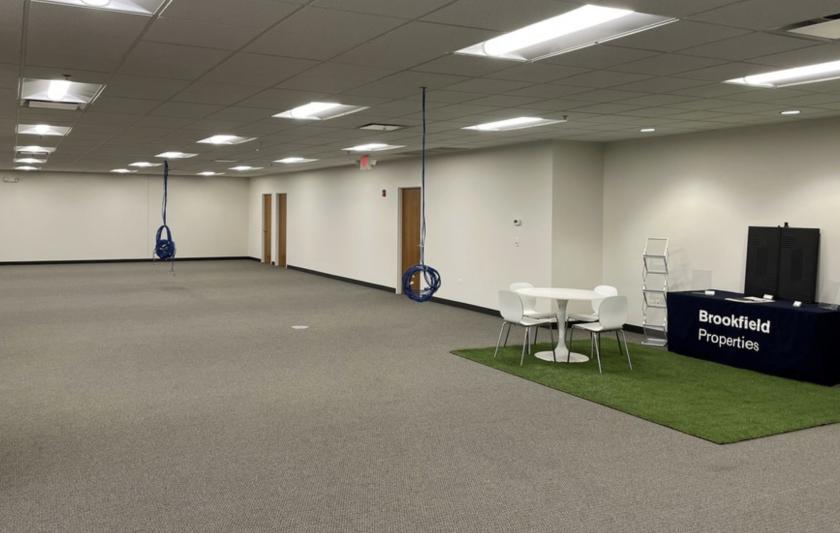
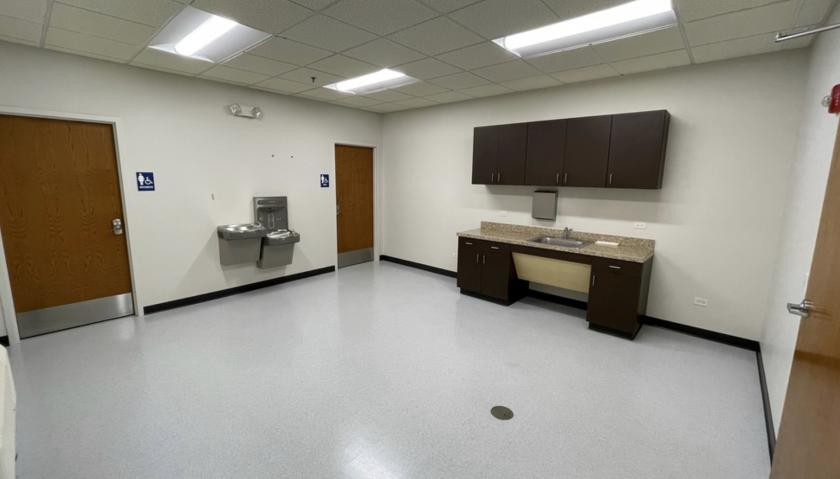
Additional Photos
Listing Agents

Dan Leahy
O: 630-691-0604
dleahy@hiffman.com
O: 630-691-0604
dleahy@hiffman.com

Steven Bass
O: 630-317-0738
M: 773-426-7227
sbass@hiffman.com
O: 630-317-0738
M: 773-426-7227
sbass@hiffman.com

Bruce Granger
O: 630-693-0648
M: 708-987-0811
bgranger@hiffman.com
O: 630-693-0648
M: 708-987-0811
bgranger@hiffman.com
While we strive to provide the most accurate information, all listing information, and demographic data, is provided by third-parties. As such, MyEListing will not be responsible for the accuracy of the information. It is strongly recommended that you verify all information with the listing agent, and any relevant agencies, prior to making any decisions.


