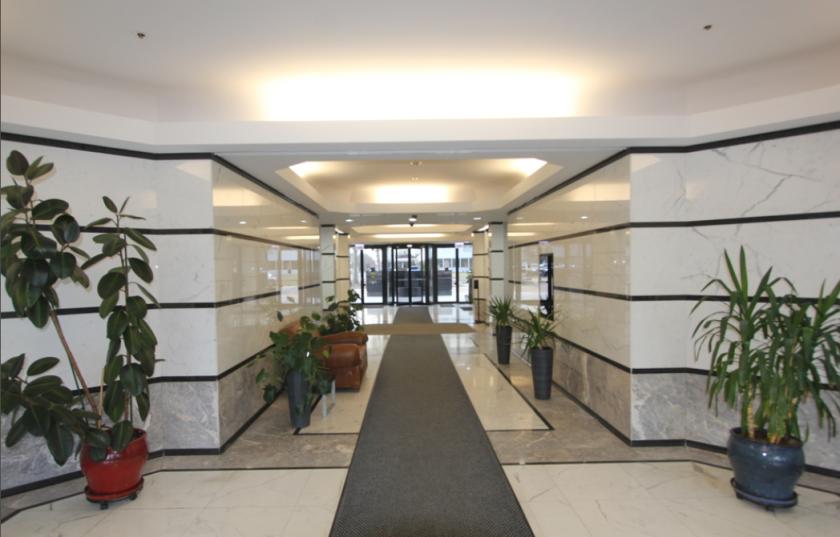
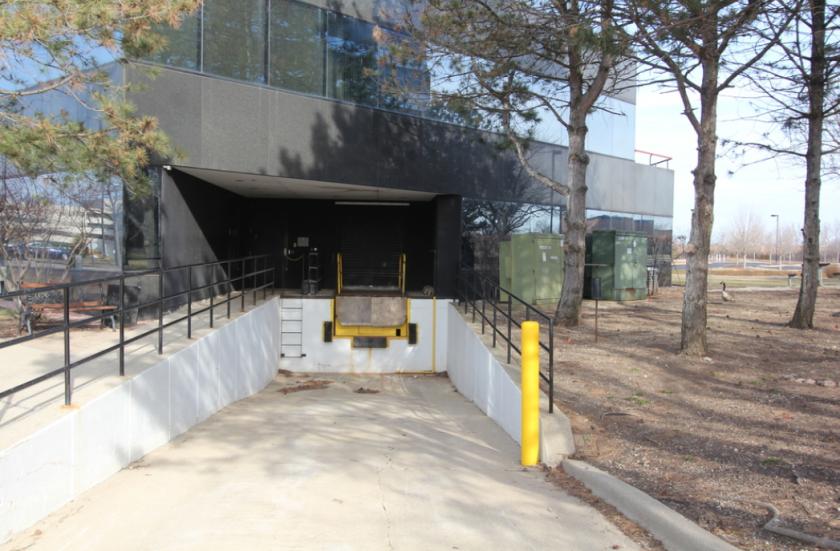
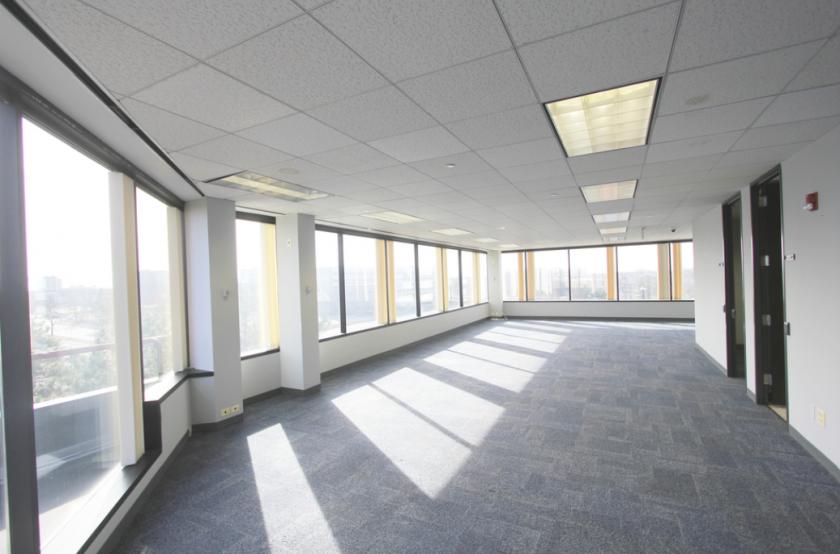
1-Mile | 3-Miles | 5-Miles | ||
---|---|---|---|---|
Total Population | 6,034 | 88,830 | 267,024 | |
Population Median Age | 37 | 39 | 40 | |
Population by Age | 0-9 Yrs | 820 (13%) | 11003 (12%) | 32181 (12%) |
10-19 Yrs | 523 (8%) | 9513 (10%) | 30124 (11%) | |
20-29 Yrs | 830 (13%) | 10863 (12%) | 31105 (11%) | |
30-39 Yrs | 1406 (23%) | 13764 (15%) | 38612 (14%) | |
40-49 Yrs | 661 (10%) | 12101 (13%) | 36336 (13%) | |
50-59 Yrs | 663 (10%) | 12332 (13%) | 37506 (14%) | |
60-69 Yrs | 606 (10%) | 10136 (11%) | 31970 (11%) | |
70+ Yrs | 524 (8%) | 9118 (10%) | 29190 (10%) | |
Median HH Income | $83,407 | $80,940 | $84,882 | |
Total Household Income | < 24K | 255 (10%) | 3793 (10%) | 10954 (10%) |
25-49K | 404 (16%) | 5857 (16%) | 16825 (16%) | |
50-74K | 447 (17%) | 6405 (18%) | 17900 (17%) | |
75-99K | 467 (18%) | 5296 (15%) | 15578 (15%) | |
100-199K | 656 (25%) | 9867 (28%) | 31669 (30%) | |
200K+ | 297 (11%) | 3409 (9%) | 10750 (10%) | |
Highest Education Level | No Diploma | 192 | 5663 | 13650 |
Diploma or GED | 736 | 12398 | 38802 | |
Some College | 611 | 11514 | 36220 | |
Assoc. Degree | 254 | 4512 | 14455 | |
Bachelors Degree | 1510 | 18854 | 56239 | |
Higher Degree | 1053 | 10712 | 32146 | |
Total Housing Units | 2,567 | 37,141 | 109,873 | |
--Owner-Occupied | 1,194 | 23,008 | 73,268 | |
--Renter-Occupied | 1,331 | 11,618 | 30,409 | |
Owner-Occupied Values | < 100K | 72 | 1674 | 4178 |
100-199K | 313 | 6237 | 15767 | |
200-299K | 238 | 5988 | 20879 | |
300-399K | 128 | 4771 | 17347 | |
400-499K | 79 | 2339 | 7808 | |
500K+ | 365 | 1999 | 7289 | |
Total Working Age Population | 4,913 | 71,945 | 215,812 | |
In Work Force | 3,503 | 50,301 | 150,525 | |
Not In Work Force | 1,410 | 21,644 | 65,287 | |
Workforce Employed | 3,346 | 48,344 | 144,626 | |
Workforce Unemployed | 157 | 1,883 | 5,740 | |
Civlian Workforce | 3,503 | 50,227 | 150,366 | |
Military Workforce | 0 | 74 | 159 | |
Total Households | 2,525 | 34,626 | 103,677 | |
Family Households | 1,456 | 22,461 | 69,208 | |
Non-Family Households | 1,069 | 12,165 | 34,469 | |
Married Couple | 1,261 | 18,103 | 56,504 | |
Other Family | 195 | 4,358 | 12,705 | |
Married w/Child | 661 | 8,081 | 24,343 | |
Single Male w/Child | 35 | 588 | 1,484 | |
Single Female w/Child | 40 | 1,256 | 3,860 |
Population Change Last Two Decades - Plus Projection
2000 | % | 2010 | % | 2020 | % | 2030 | |
---|---|---|---|---|---|---|---|
Illinois | 12,419,293 | +3 | 12,830,632 | +12 | 14,316,487 | +6 | 15,138,849 |
Cook County | 5,376,741 | -3 | 5,194,675 | +10 | 5,707,832 | +5 | 5,990,243 |
DuPage County | 904,161 | +1 | 916,924 | +10 | 1,010,323 | +2 | 1,034,039 |
Total Working Age Population:
Total Households:
Total Working Age Population:
Total Households:
Total Working Age Population:
Total Households: