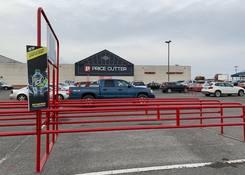
Retail Space
706 Venture Drive Morgantown, WV 26508
706 Venture Drive Morgantown, WV 26508

Details & Description
Property Highlights
• 3 Miles from West Virginia University and Downtown Morgantown
• Most Dominant Retail Destination East of Downtown Morgantown
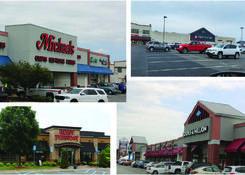
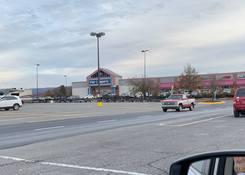
Additional Photos

Listing Agents

Angelica Beltran
O: 757-627-9088
M: 757-621-8682
angelica@whlr.us
O: 757-627-9088
M: 757-621-8682
angelica@whlr.us
While we strive to provide the most accurate information, all listing information, and demographic data, is provided by third-parties. As such, MyEListing will not be responsible for the accuracy of the information. It is strongly recommended that you verify all information with the listing agent, and any relevant agencies, prior to making any decisions.


