Office Space
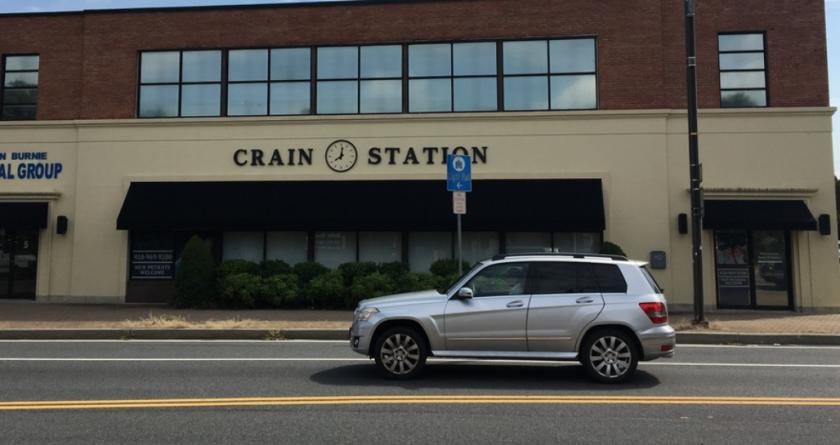
5 Crain Highway North Glen Burnie, MD 21061
5 Crain Highway North Glen Burnie, MD 21061
Details & Description
Property Highlights
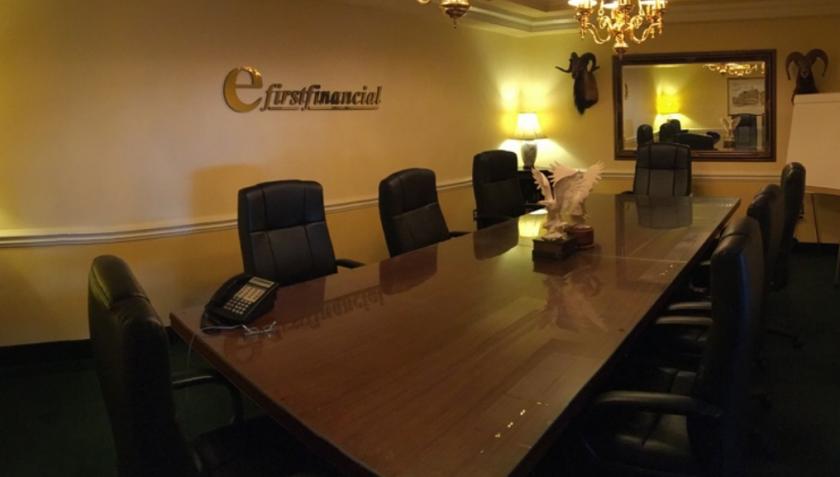
• Layout includes receptionwaiting area, large open space bull-pen, three private offices and a conference room
• Walking distance to The Glen Burnie Town Center, AACC and the District Court.
Listing Agents

Joe Sera
O: 410-266-1113
M: 443-223-0371
jsera@murphycre.com
O: 410-266-1113
M: 443-223-0371
jsera@murphycre.com
While we strive to provide the most accurate information, all listing information, and demographic data, is provided by third-parties. As such, MyEListing will not be responsible for the accuracy of the information. It is strongly recommended that you verify all information with the listing agent, and any relevant agencies, prior to making any decisions.