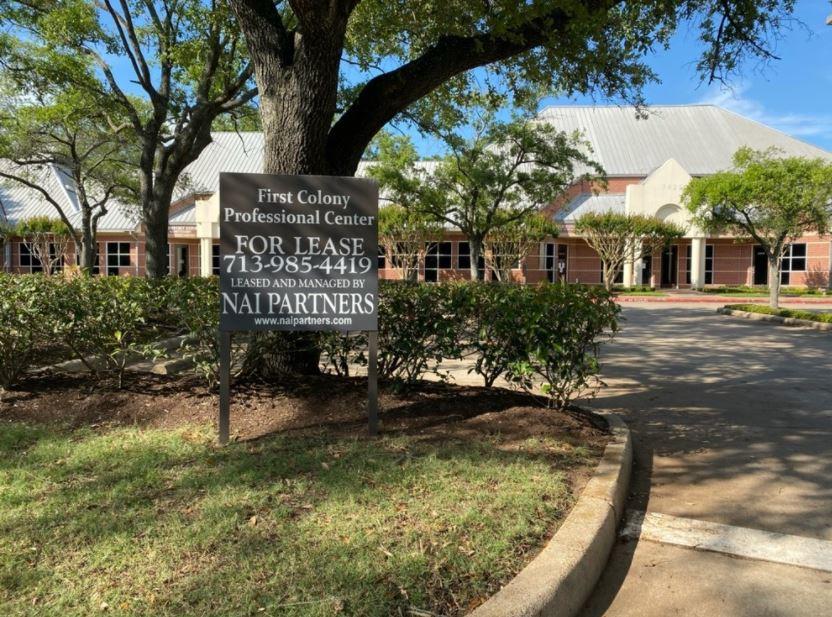
Office Space
3425 Highway 6 Sugar Land, TX 77478
3425 Highway 6 Sugar Land, TX 77478
Details & Description
Property Highlights
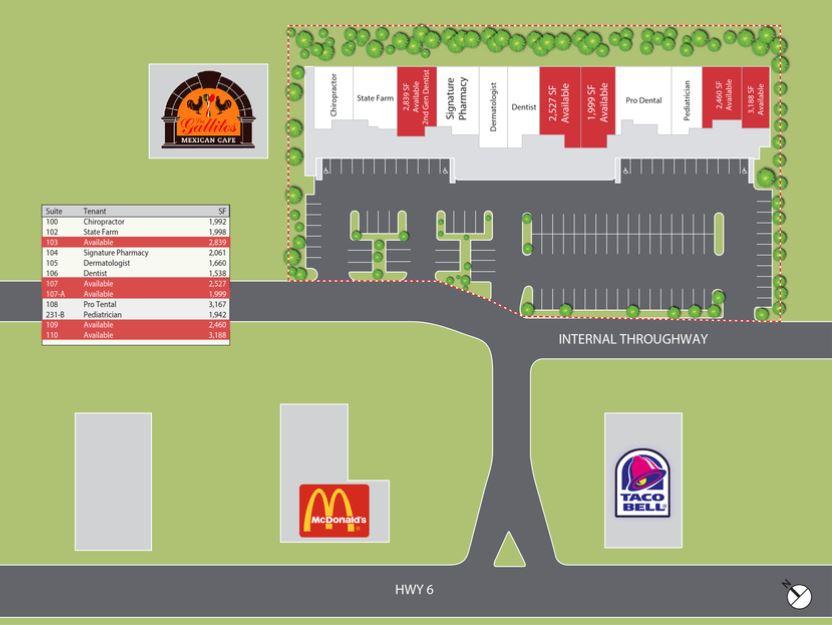
• Previously Occupied Medical Clinic Hair Salon Spaces with Below Market Lease Terms
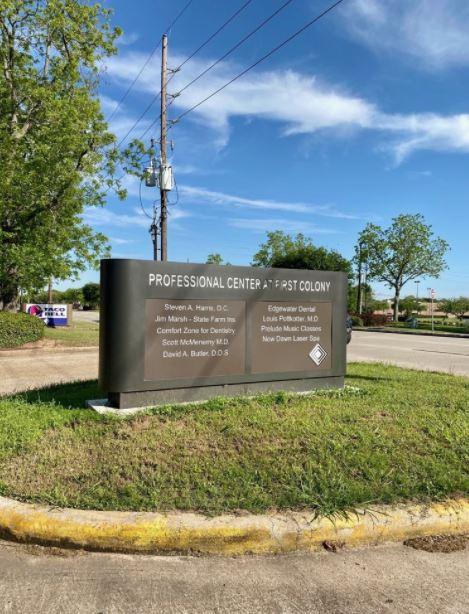
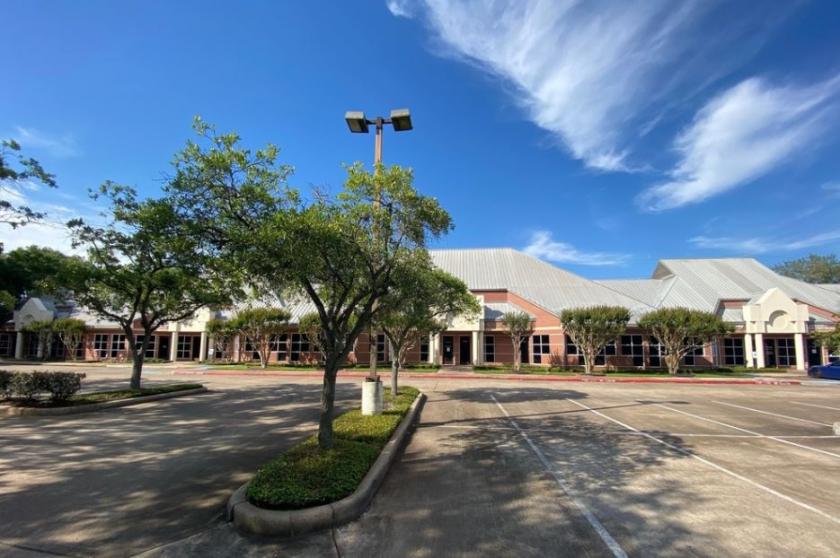
• High Quality Medical Professional Space in the Heart of Sugar Land
Additional Photos

Listing Agents

Jason Gaines
O: 713-543-0025
jason@sturbridgecre.com
O: 713-543-0025
jason@sturbridgecre.com

Zach Leger
O: 713-275-9605
zach.leger@partnersrealestate.com
O: 713-275-9605
zach.leger@partnersrealestate.com
While we strive to provide the most accurate information, all listing information, and demographic data, is provided by third-parties. As such, MyEListing will not be responsible for the accuracy of the information. It is strongly recommended that you verify all information with the listing agent, and any relevant agencies, prior to making any decisions.


