Industrial Properties
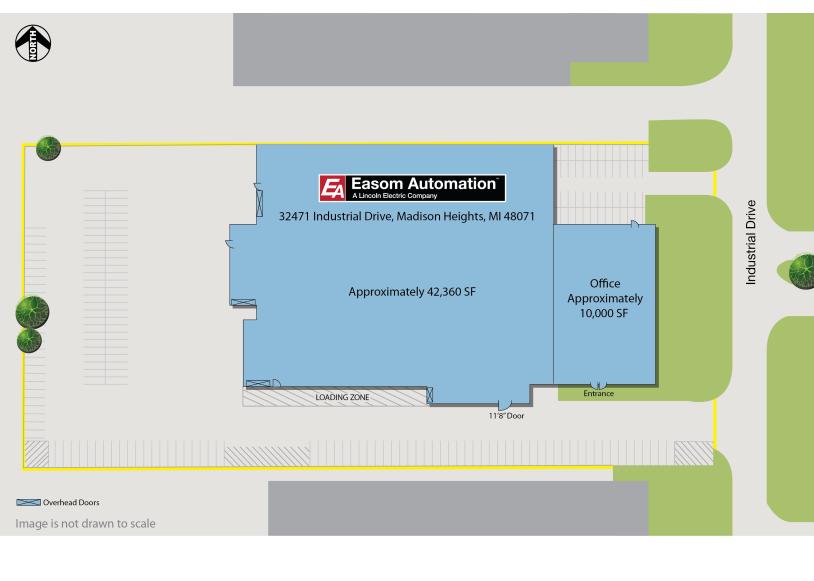
32471 Industrial Drive Madison Heights, MI 48071
32471 Industrial Drive Madison Heights, MI 48071
Details & Description
Property Highlights
- • 52,360 SF of Industrial Available
- • High Ceiling - 27
- • Truck Well
- • 10,000 SF of Office Space
- • 6 Cranes
- • Access to I-75 and I-696
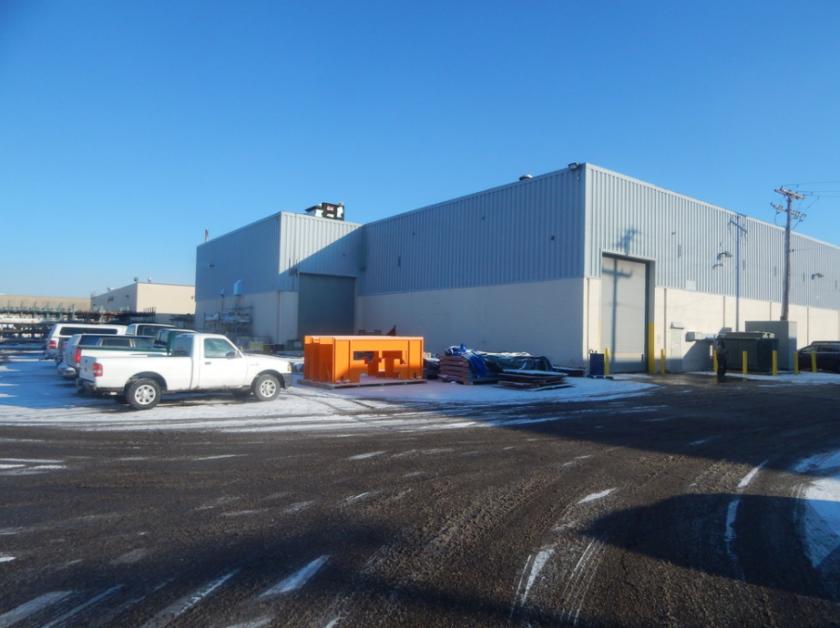
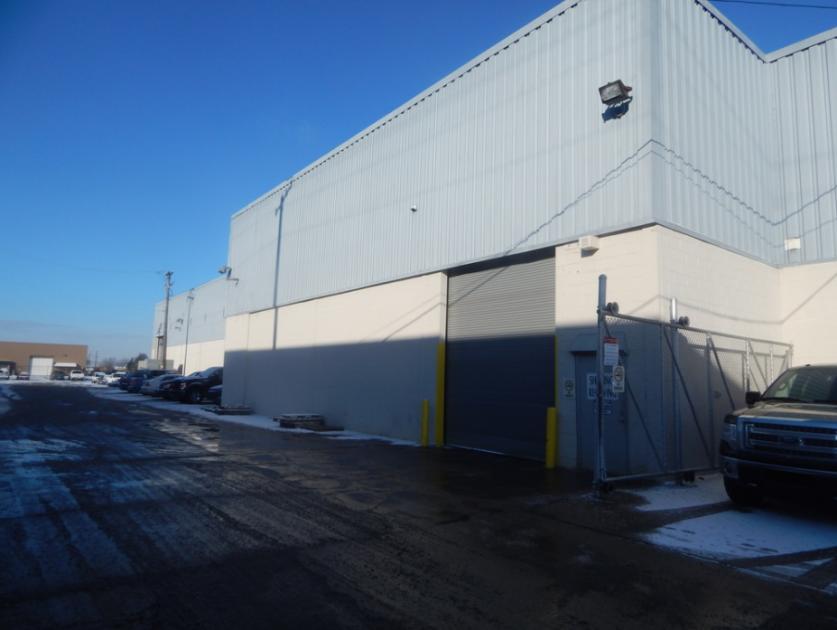
Additional Photos

Listing Agents

John Harwood
O: 734-755-0488
harwood@farbman.com
O: 734-755-0488
harwood@farbman.com
While we strive to provide the most accurate information, all listing information, and demographic data, is provided by third-parties. As such, MyEListing will not be responsible for the accuracy of the information. It is strongly recommended that you verify all information with the listing agent, and any relevant agencies, prior to making any decisions.


