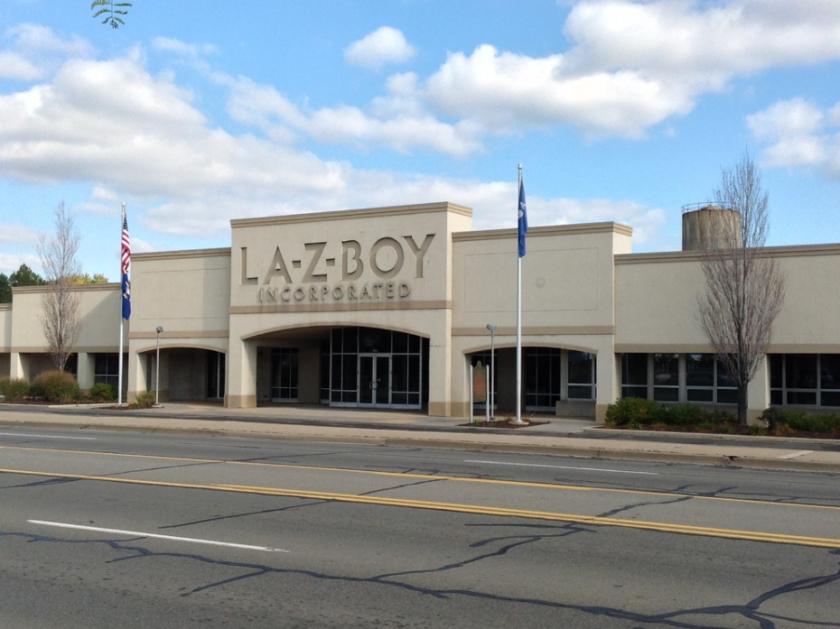
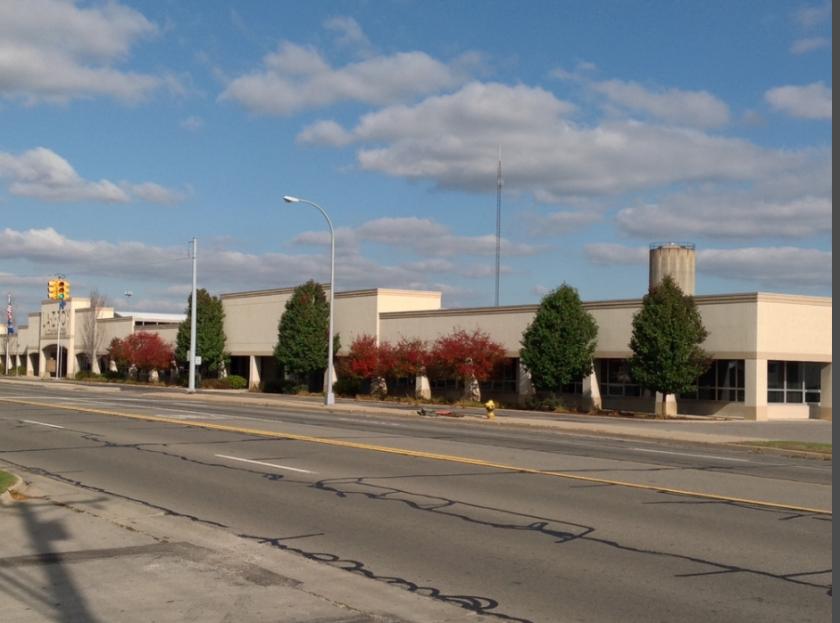
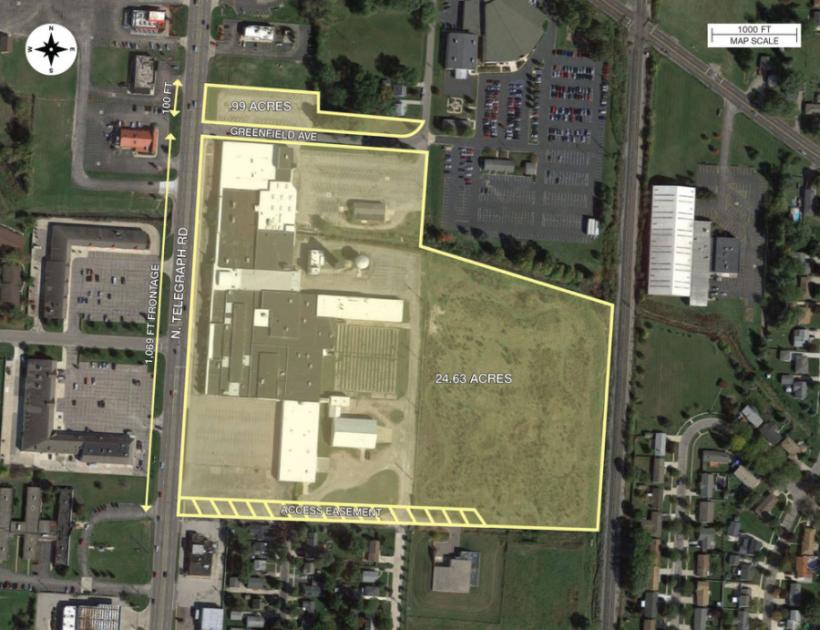
1-Mile | 3-Miles | 5-Miles | ||
---|---|---|---|---|
Total Population | 5,431 | 33,951 | 52,997 | |
Population Median Age | 42 | 40 | 40 | |
Population by Age | 0-9 Yrs | 636 (11%) | 4093 (12%) | 6305 (11%) |
10-19 Yrs | 486 (8%) | 3953 (11%) | 6620 (12%) | |
20-29 Yrs | 835 (15%) | 4635 (13%) | 6998 (13%) | |
30-39 Yrs | 603 (11%) | 4023 (11%) | 6341 (11%) | |
40-49 Yrs | 668 (12%) | 4054 (11%) | 6464 (12%) | |
50-59 Yrs | 717 (13%) | 4793 (14%) | 7337 (13%) | |
60-69 Yrs | 565 (10%) | 4125 (12%) | 6734 (12%) | |
70+ Yrs | 921 (16%) | 4274 (12%) | 6197 (11%) | |
Median HH Income | $36,976 | $48,949 | $51,648 | |
Total Household Income | < 24K | 754 (29%) | 3754 (26%) | 5544 (25%) |
25-49K | 797 (31%) | 3497 (24%) | 5106 (23%) | |
50-74K | 345 (13%) | 2833 (19%) | 4224 (19%) | |
75-99K | 328 (12%) | 1802 (12%) | 2973 (13%) | |
100-199K | 315 (12%) | 2137 (14%) | 3580 (16%) | |
200K+ | 24 (0%) | 299 (2%) | 531 (2%) | |
Highest Education Level | No Diploma | 268 | 2704 | 4233 |
Diploma or GED | 1385 | 8194 | 13016 | |
Some College | 868 | 5631 | 8617 | |
Assoc. Degree | 563 | 2547 | 3824 | |
Bachelors Degree | 451 | 2982 | 4510 | |
Higher Degree | 297 | 1665 | 2435 | |
Total Housing Units | 2,688 | 15,551 | 23,786 | |
--Owner-Occupied | 1,161 | 8,826 | 15,001 | |
--Renter-Occupied | 1,401 | 5,498 | 6,958 | |
Owner-Occupied Values | < 100K | 216 | 2572 | 4694 |
100-199K | 676 | 4364 | 6615 | |
200-299K | 223 | 1384 | 2507 | |
300-399K | 43 | 338 | 760 | |
400-499K | 2 | 103 | 215 | |
500K+ | 1 | 65 | 210 | |
Total Working Age Population | 4,524 | 27,469 | 42,919 | |
In Work Force | 2,701 | 16,104 | 25,161 | |
Not In Work Force | 1,823 | 11,364 | 17,757 | |
Workforce Employed | 2,620 | 15,208 | 23,571 | |
Workforce Unemployed | 81 | 896 | 1,579 | |
Civlian Workforce | 2,701 | 16,104 | 25,150 | |
Military Workforce | 0 | 0 | 11 | |
Total Households | 2,562 | 14,323 | 21,958 | |
Family Households | 1,221 | 8,512 | 13,762 | |
Non-Family Households | 1,341 | 5,811 | 8,197 | |
Married Couple | 799 | 6,029 | 9,676 | |
Other Family | 422 | 2,483 | 4,086 | |
Married w/Child | 353 | 2,205 | 3,485 | |
Single Male w/Child | 97 | 434 | 633 | |
Single Female w/Child | 189 | 966 | 1,656 |
Population Change Last Two Decades - Plus Projection
2000 | % | 2010 | % | 2020 | % | 2030 | |
---|---|---|---|---|---|---|---|
Michigan | 9,938,444 | -1 | 9,883,640 | +1 | 10,023,423 | +4 | 10,424,510 |
Monroe County | 145,945 | +4 | 152,021 | -2 | 149,610 | +2 | 153,038 |
Ohio | 11,353,140 | +2 | 11,536,504 | 0 | 11,574,870 | 0 | 11,615,100 |
Lucas County | 455,054 | -3 | 441,815 | -3 | 430,450 | -2 | 420,080 |
Total Working Age Population:
Total Households:
Total Working Age Population:
Total Households:
Total Working Age Population:
Total Households: