Industrial Properties
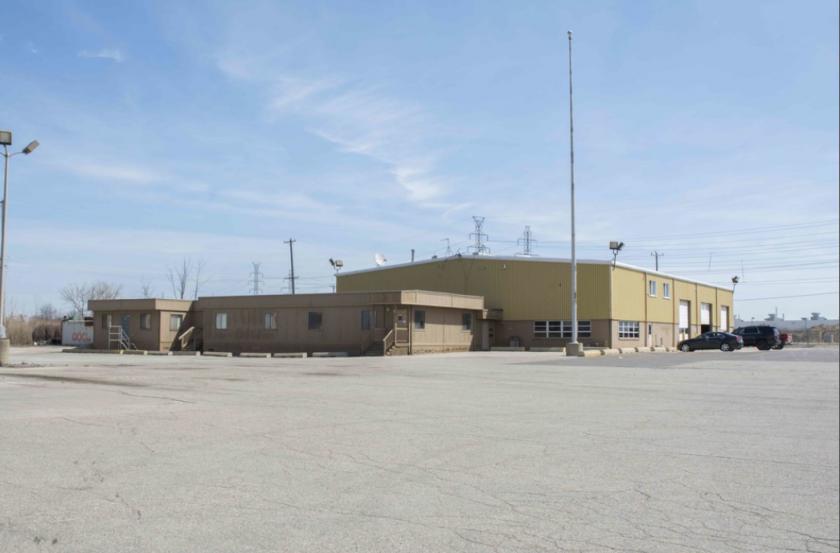
2650 Van Horn Road Trenton, MI 48183
2650 Van Horn Road Trenton, MI 48183
Details & Description
Property Highlights
- • Prime Location
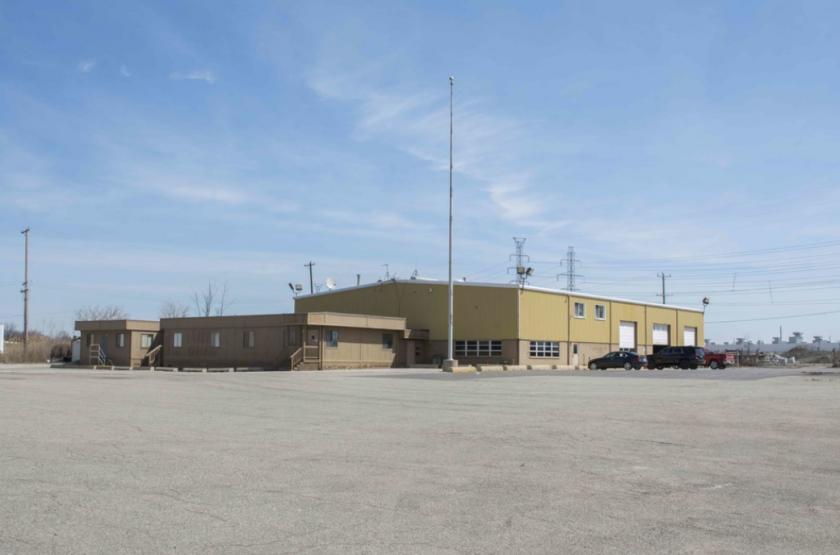
- • Zoned Industrial
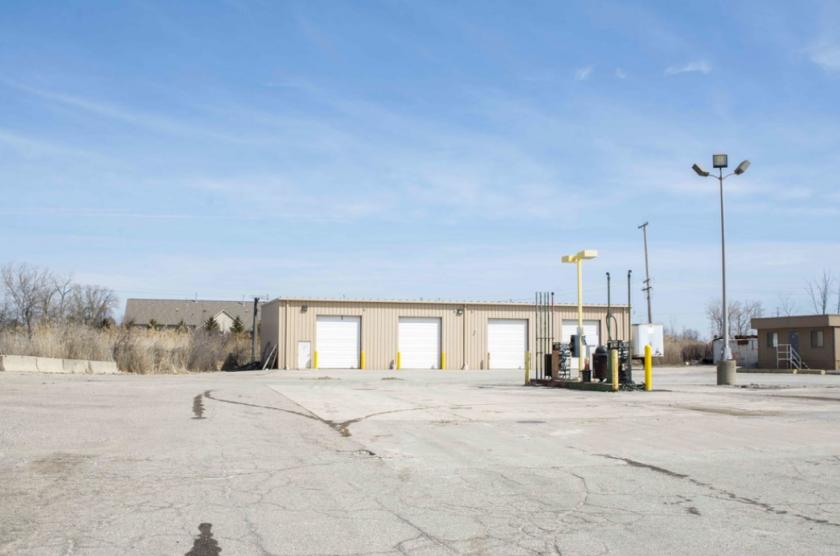
- • 7 High Garage Door Bays
- • Paved Yard Area
- • 435 Feet of Van Horn Road Frontage
- • Full Service Garage Near Chrysler Plant
Additional Photos

Listing Agents

John Harwood
O: 734-755-0488
harwood@farbman.com
O: 734-755-0488
harwood@farbman.com
While we strive to provide the most accurate information, all listing information, and demographic data, is provided by third-parties. As such, MyEListing will not be responsible for the accuracy of the information. It is strongly recommended that you verify all information with the listing agent, and any relevant agencies, prior to making any decisions.


