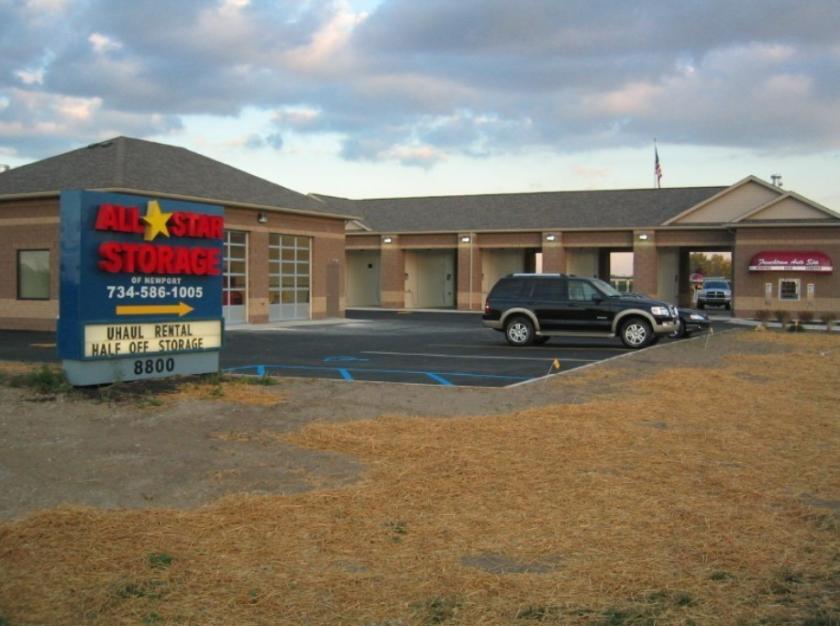
Retail Space
8858 North Telegraph Road Carleton, MI 48117
8858 North Telegraph Road Carleton, MI 48117
Details & Description
Property Highlights
- • For Sale or Lease
- • Located on 1.1 Acre Parcel
- • Traffic Counts N Telegraph Rd 19,200 Cars Per Day
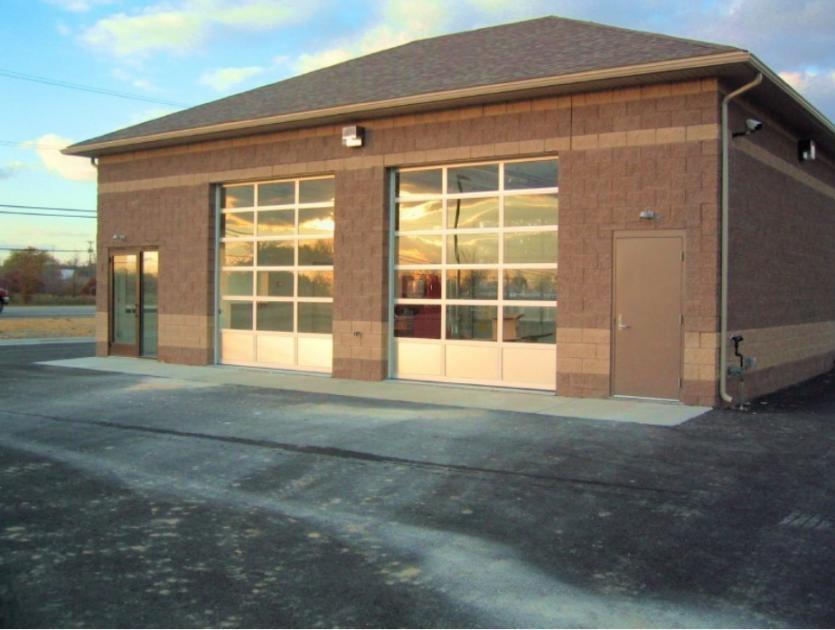
- • Quick Change Oil Location with Car Wash
- • On Telegraph Rd Near I-275
- • Reduced Price to $495,000
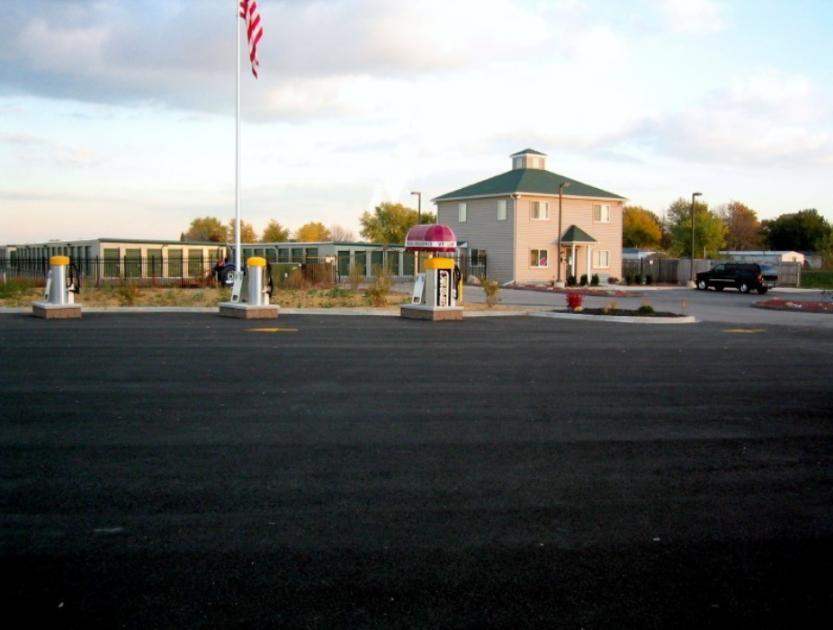
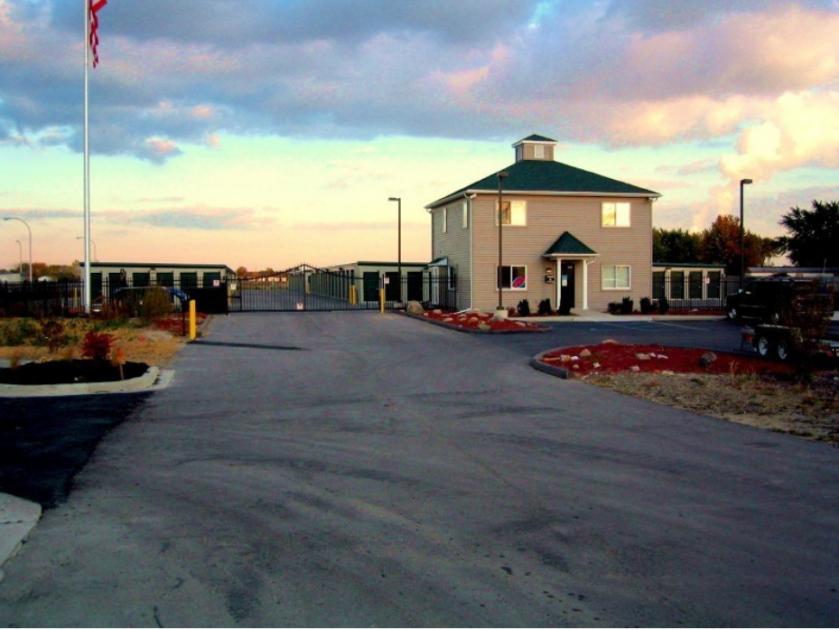
Additional Photos
Listing Agents

John Harwood
O: 734-755-0488
harwood@farbman.com
O: 734-755-0488
harwood@farbman.com
While we strive to provide the most accurate information, all listing information, and demographic data, is provided by third-parties. As such, MyEListing will not be responsible for the accuracy of the information. It is strongly recommended that you verify all information with the listing agent, and any relevant agencies, prior to making any decisions.


