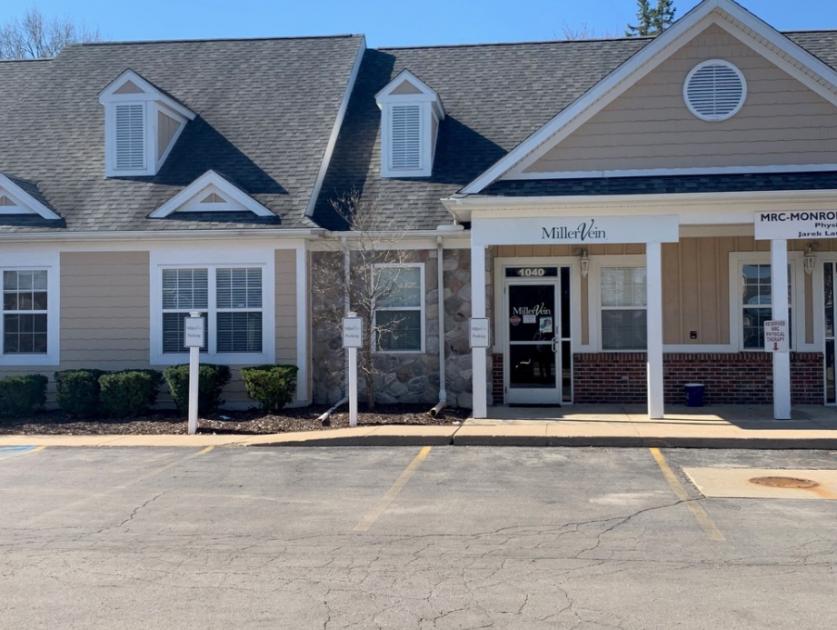
Office Space
1040 North Monroe Street Monroe, MI 48162
1040 North Monroe Street Monroe, MI 48162
Details & Description
Property Highlights
- • For Sale 2,600 SF
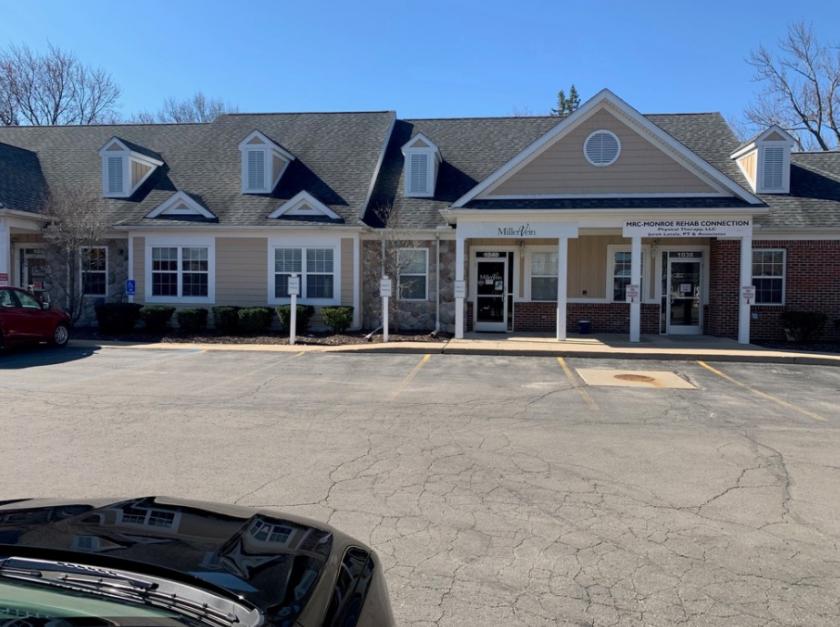
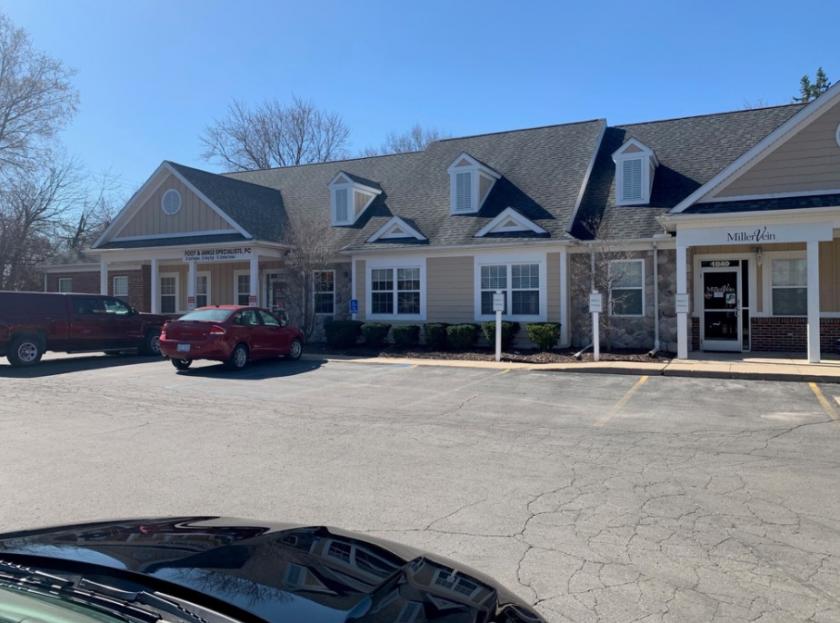
- • Ample Parking
- • Zoning C-1
- • Office Opportunity in MedicalOffice Complex
- • Located in the Delilse Center
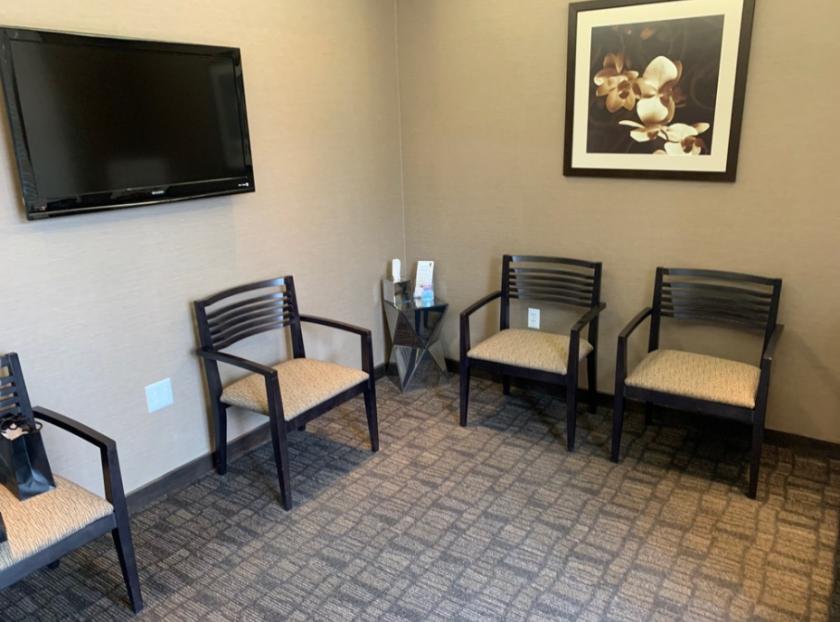
- • High End Medical Finishes
Additional Photos
Listing Agents

John Harwood
O: 734-755-0488
harwood@farbman.com
O: 734-755-0488
harwood@farbman.com

Kristi Lawton
O: 248-351-4358
M: 248-798-9828
lawton@farbman.com
O: 248-351-4358
M: 248-798-9828
lawton@farbman.com

Jeff Cavazos
O: 248-351-4392
M: 248-613-6457
jcavazos@farbman.com
O: 248-351-4392
M: 248-613-6457
jcavazos@farbman.com
While we strive to provide the most accurate information, all listing information, and demographic data, is provided by third-parties. As such, MyEListing will not be responsible for the accuracy of the information. It is strongly recommended that you verify all information with the listing agent, and any relevant agencies, prior to making any decisions.


