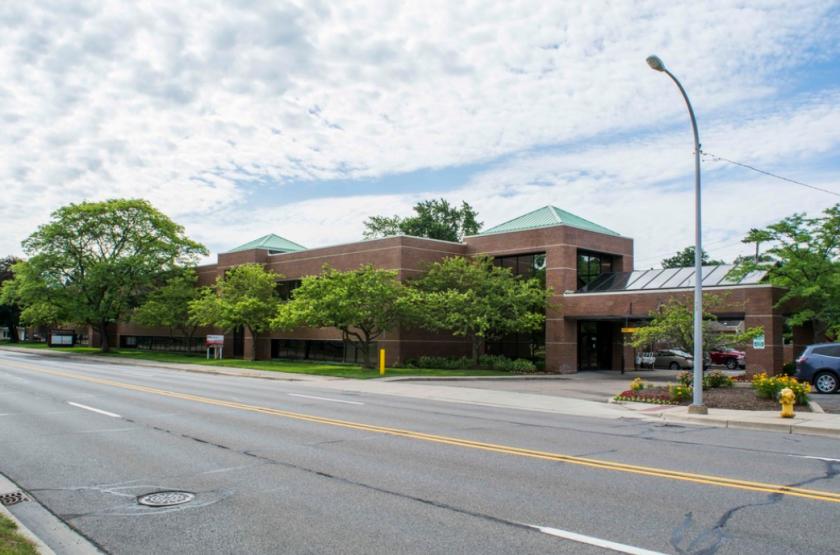
Office Space
1695 West Twelve Mile Road Berkley, MI 48072
1695 West Twelve Mile Road Berkley, MI 48072
Details & Description
Property Highlights
- • Great Visibility
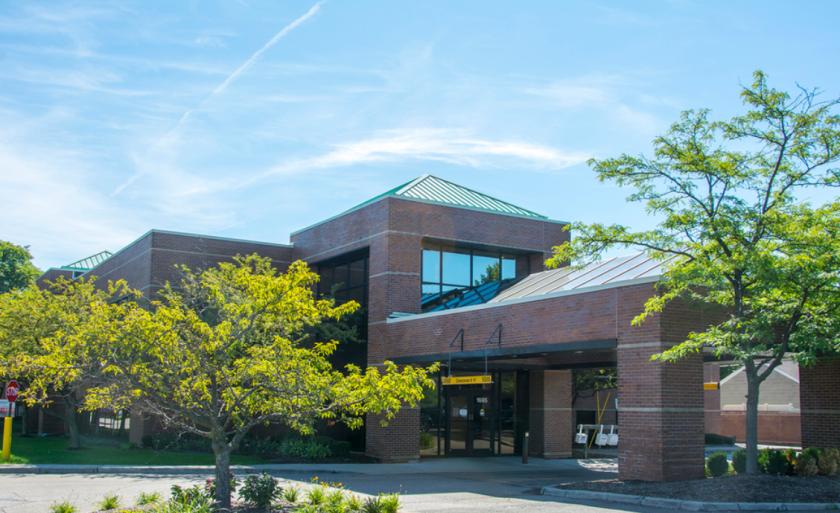
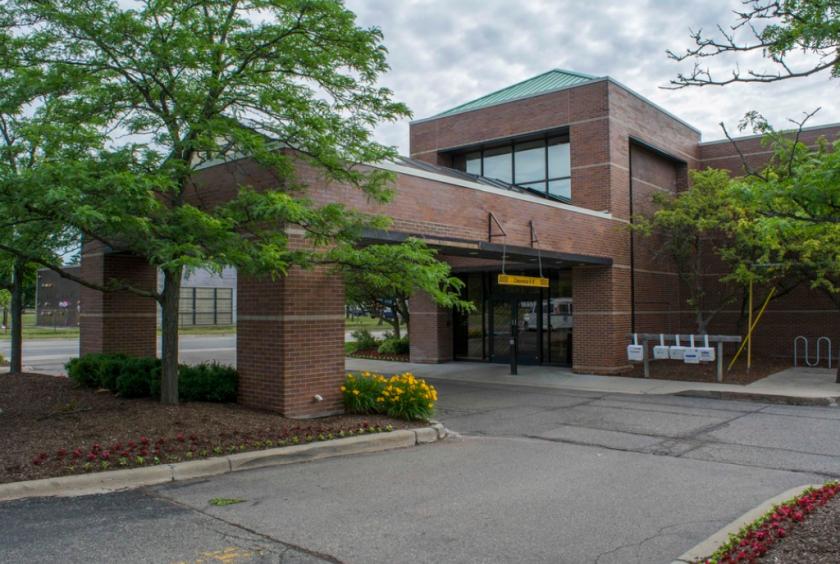
- • Covered Drop Off
- • Abundant Shared Parking
- • High Traffic Area
- • One Mile from Beaumont Health Royal Oak Campus
- • Monument Signage Available
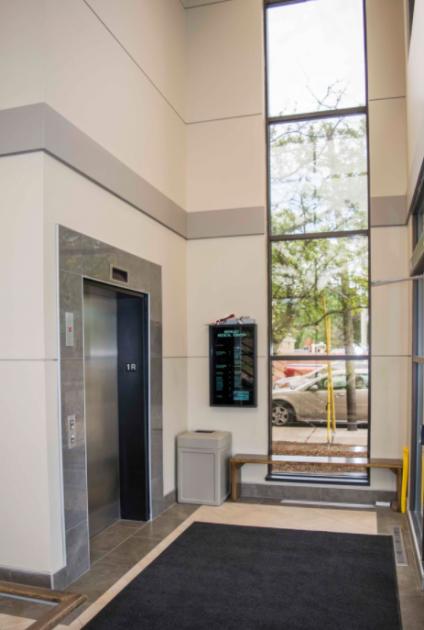
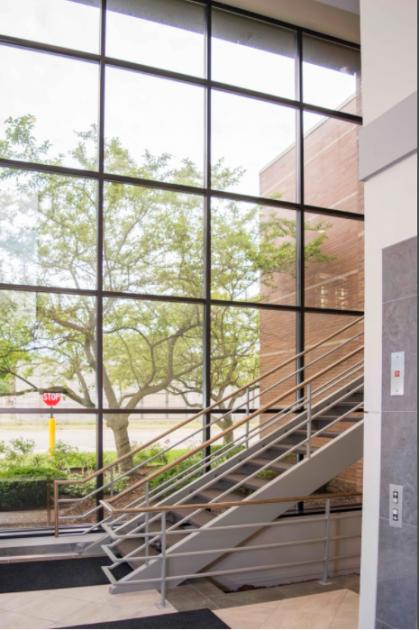
Additional Photos
Listing Agents

Jeff Cavazos
O: 248-351-4392
M: 248-613-6457
jcavazos@farbman.com
O: 248-351-4392
M: 248-613-6457
jcavazos@farbman.com

Kristi Lawton
O: 248-351-4358
M: 248-798-9828
lawton@farbman.com
O: 248-351-4358
M: 248-798-9828
lawton@farbman.com
While we strive to provide the most accurate information, all listing information, and demographic data, is provided by third-parties. As such, MyEListing will not be responsible for the accuracy of the information. It is strongly recommended that you verify all information with the listing agent, and any relevant agencies, prior to making any decisions.


