Office Space
2244 Pacific Coast Highway Lomita, CA 90717
2244 Pacific Coast Highway Lomita, CA 90717

Details & Description
Property Highlights
- • Retail Neighborhood Shopping Center
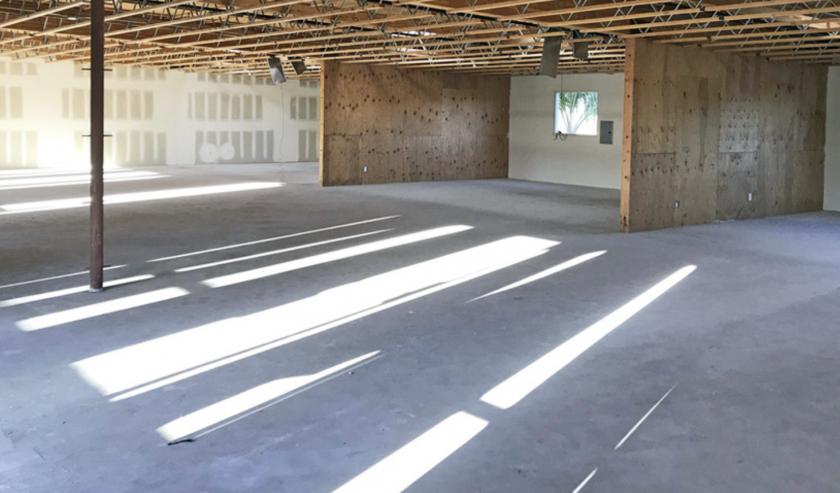
- • Newly Renovated Building
- • Landlord Will Custom Design Your Space
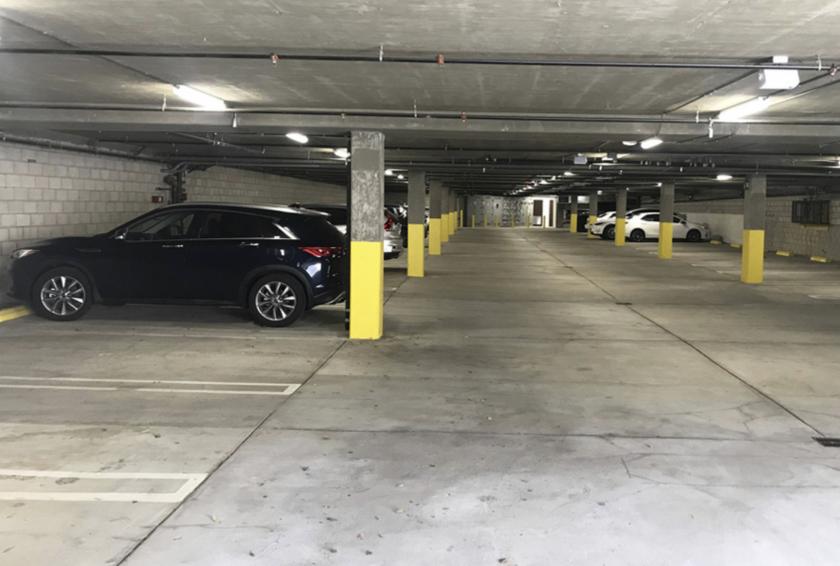
- • Surface and Underground Parking
- • Prime End-cap Space Available
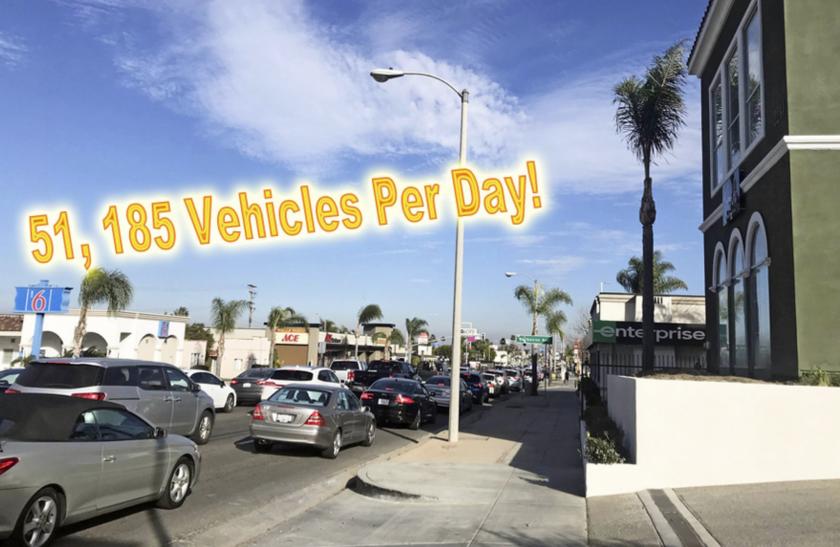
- • 51,185 Vehicles Per Day
Additional Photos
Listing Agents

Todd Rizzardi
O: 818-815-2422
trizzardi@naicapital.com
O: 818-815-2422
trizzardi@naicapital.com
While we strive to provide the most accurate information, all listing information, and demographic data, is provided by third-parties. As such, MyEListing will not be responsible for the accuracy of the information. It is strongly recommended that you verify all information with the listing agent, and any relevant agencies, prior to making any decisions.


