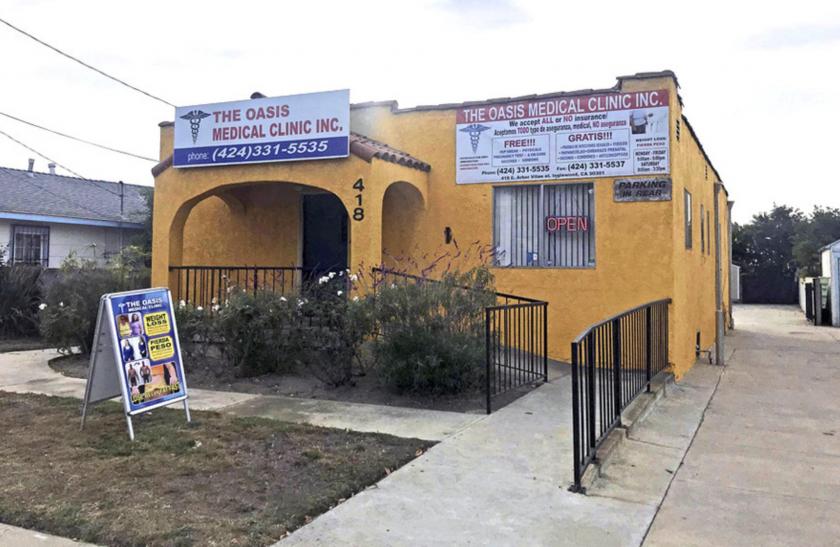
Office Space
418 East Arbor Vitae Street Inglewood, CA 90301
418 East Arbor Vitae Street Inglewood, CA 90301
Details & Description
Property Highlights
- • Single Tenant Building
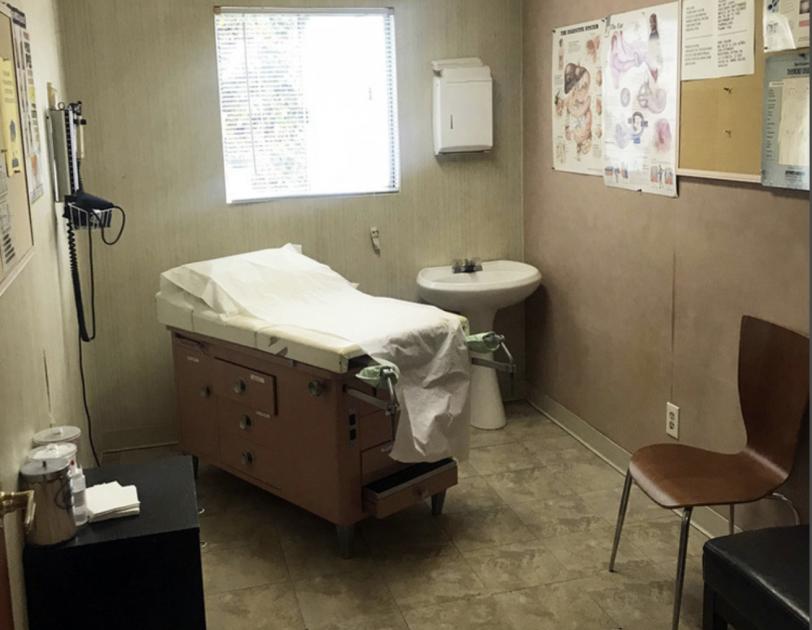
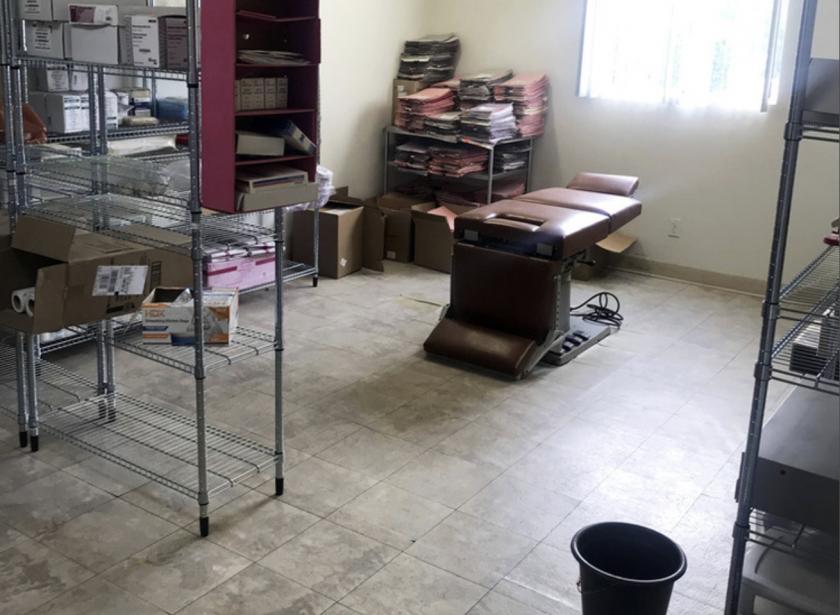
- • Turn-Key Ready for Medical or Dental Use
- • 6 Parking Spaces Free Street Parking
- • Medical Equipment Included for Use During Lease
Additional Photos


Listing Agents

Todd Rizzardi
O: 818-815-2422
trizzardi@naicapital.com
O: 818-815-2422
trizzardi@naicapital.com
While we strive to provide the most accurate information, all listing information, and demographic data, is provided by third-parties. As such, MyEListing will not be responsible for the accuracy of the information. It is strongly recommended that you verify all information with the listing agent, and any relevant agencies, prior to making any decisions.


